
To boost talent management or performance reviews, learning to make a 9 Box Grid in Excel can really help. This visual tool helps you map employees by their performance and potential. It makes strategic HR decisions clearer. In this guide, you’ll find a step-by-step tutorial. There are images for each stage, plus practical tips. These will help make your grid effective and professional.
What’s a 9 Box Grid?
A 9 Box Grid is a visual tool used in HR and talent development. It helps evaluate and group employees by two key factors: performance and potential. It forms a 3 by 3 matrix, which has nine boxes. The horizontal axis shows performance, from low to high. The vertical axis shows potential, also from low to high. Each intersection in the matrix marks a unique category. Examples include high potential with low performance or high in both. This model helps leaders make fair decisions on promotions, coaching, and succession planning. The simplicity and insight offered by the 9 Box Grid make it a staple in many HR departments.
How to Make a 9 Box Grid in Excel? Step-by-Step Guide
Step 1: Open Excel and Set Up Your Worksheet
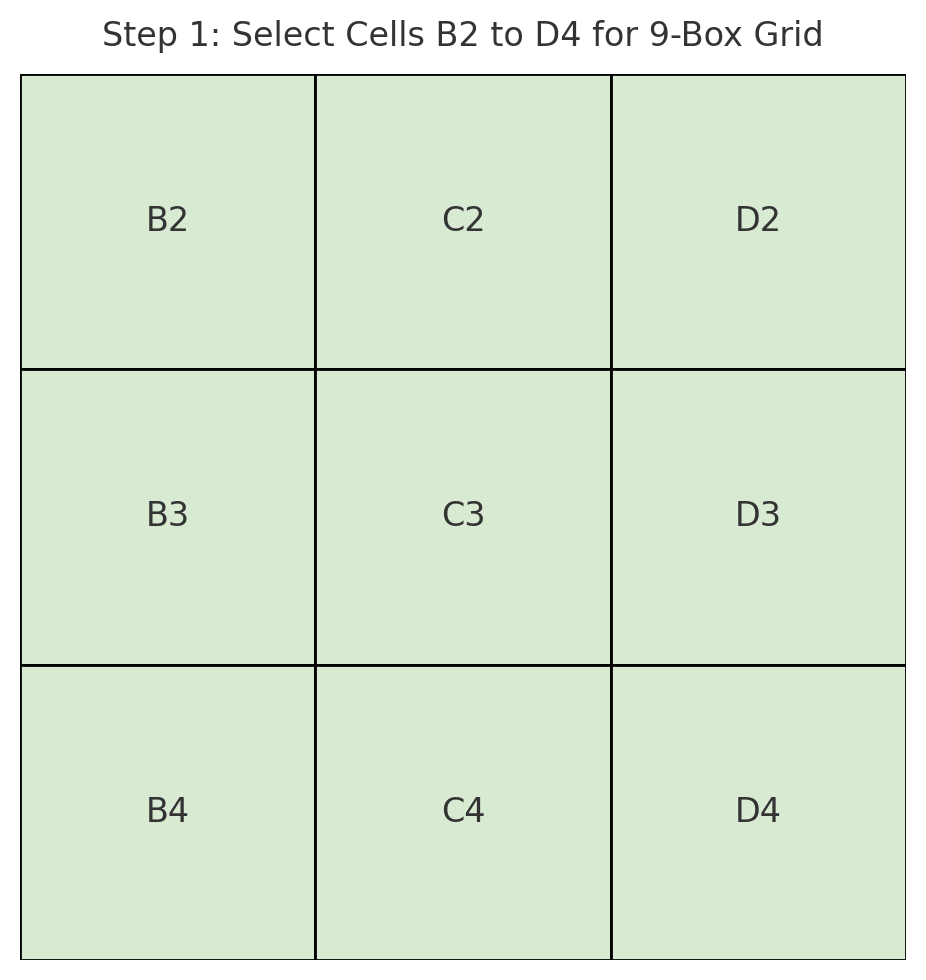
Open a blank Excel workbook. You’ll use a 3×3 table, so select a square section like cells B2 to D4 for your grid. You now have a visual placeholder for the 9 boxes.
Step 2: Adjust Row Height and Column Width
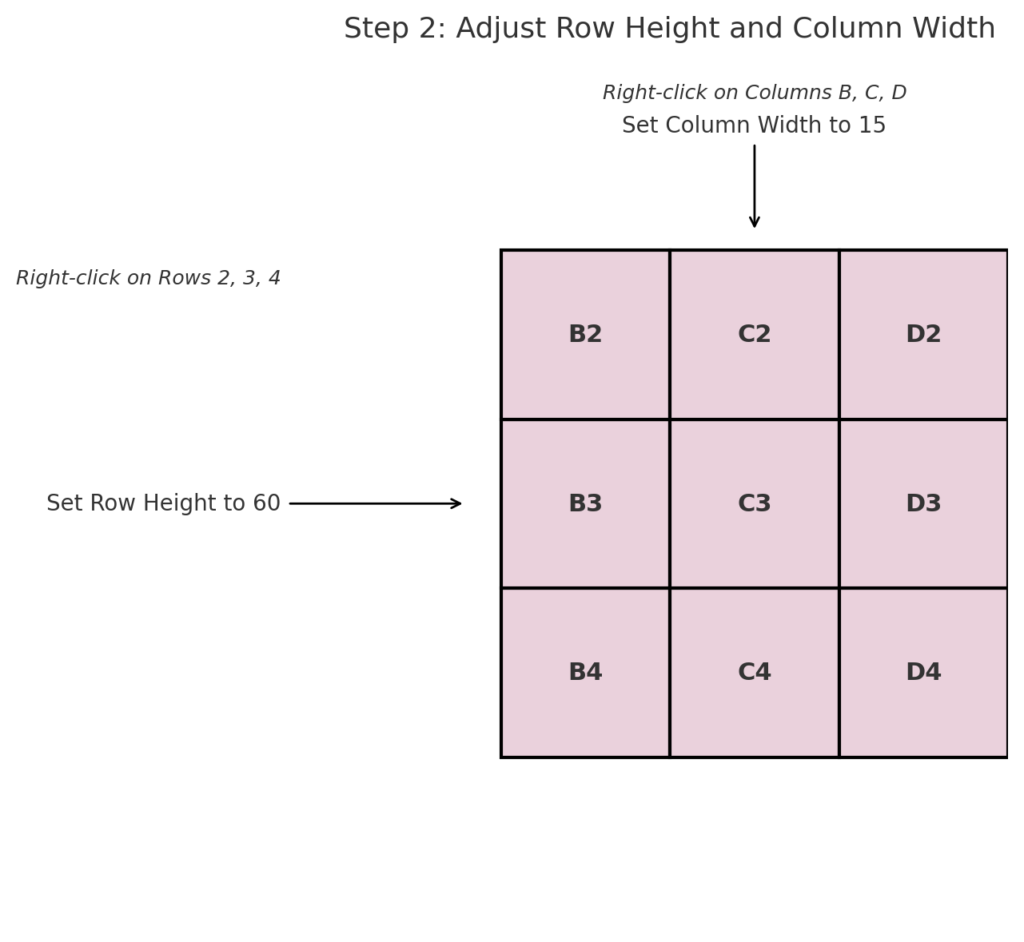
To make the grid look like a perfect square, adjust:
- Column Width: Select columns B, C, and D → Right-click → Column Width → Enter 15
- Row Height: Select rows 2, 3, and 4 → Right-click → Row Height → Enter 60
This step ensures all cells are evenly sized for a balanced grid appearance.
Step 3: Add Borders to Create the Grid
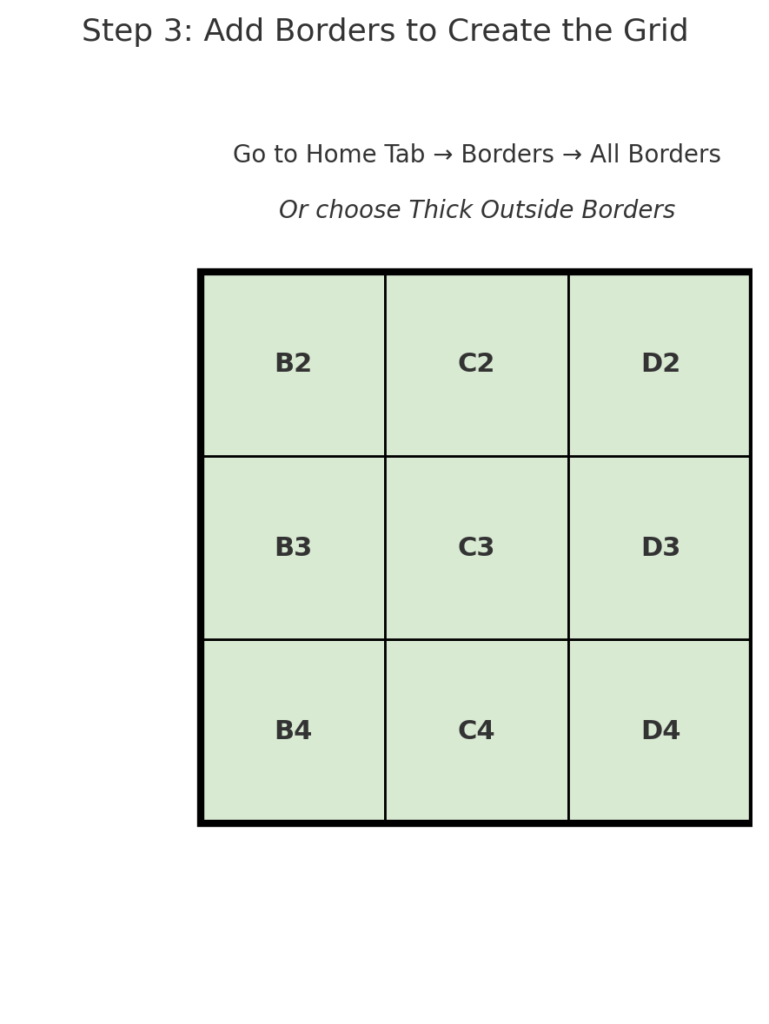
Highlight the 9 cells (B2:D4), then:
- Go to the “Home” tab
- Click the “Borders” drop-down
- Select “All Borders” or “Thick Outside Borders” for a more defined look
You now have your 9-box grid framework.
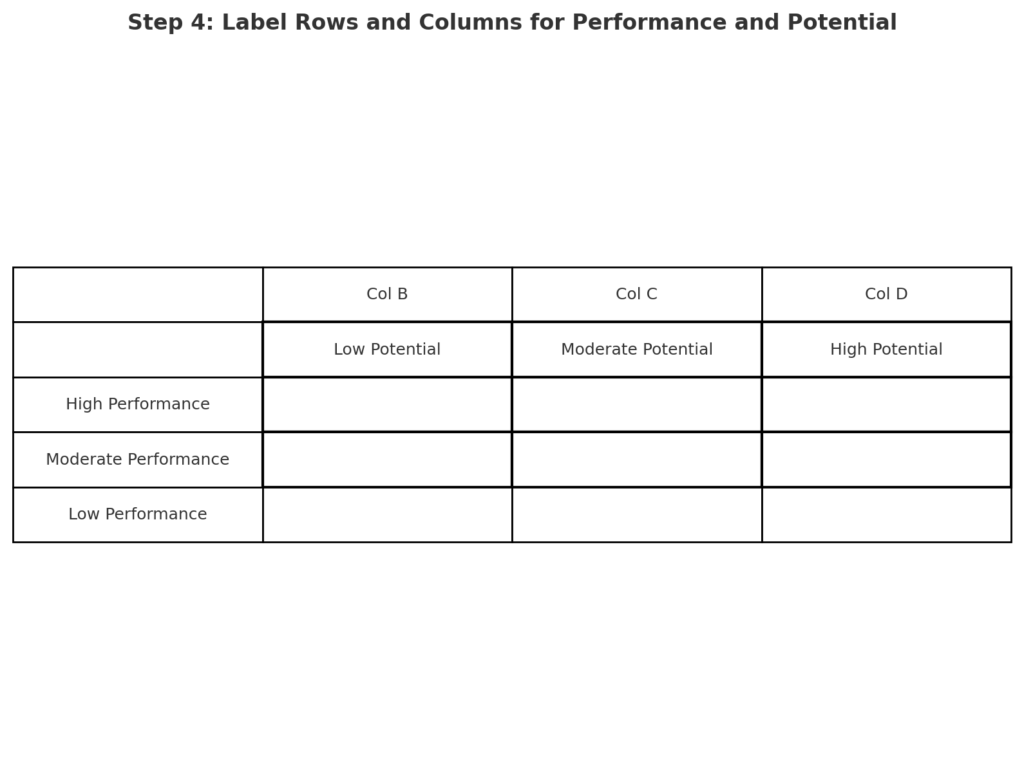
Step 4: Label the Rows and Columns
To define performance and potential, label the sides:
- In row 1, enter:
- C1: “Low Potential”
- D1: “Moderate Potential”
- E1: “High Potential”
- In column A, enter:
- A2: “High Performance”
- A3: “Moderate Performance”
- A4: “Low Performance”
You may need to rotate text or adjust alignment for better presentation.
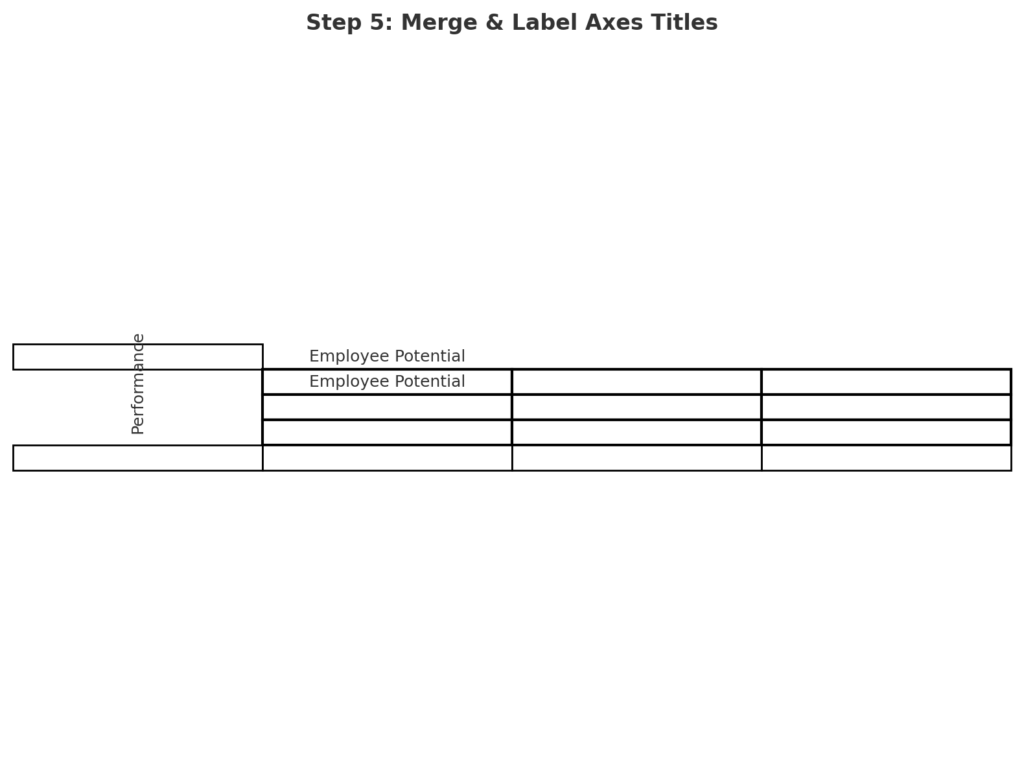
Step 5: Merge Header Cells (Optional for Design)
Merge cells if you want to create a title or section labels:
- Select cells B1 to D1 → Merge & Center → Title it “Employee Potential”
- Select A2 to A4 → Merge & Rotate Text → Title it “Performance”
This helps clarify the matrix axes visually.
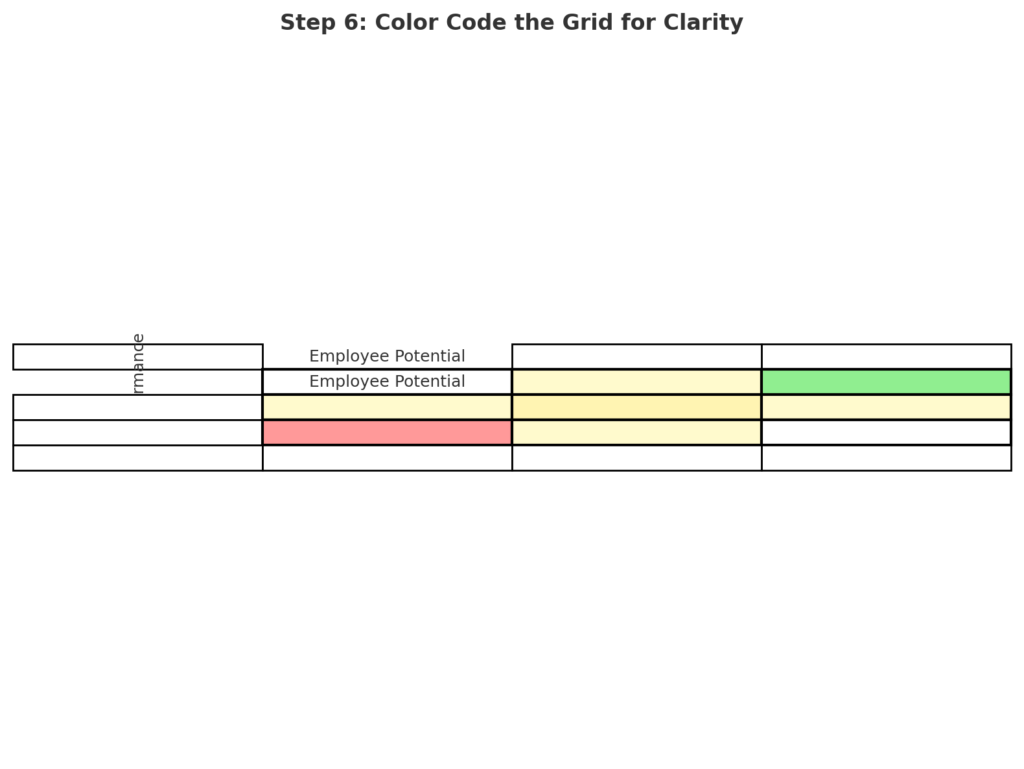
Step 6: Color Code the Boxes (Recommended for Clarity)
Color-code boxes to represent different talent categories:
- Green for “High Performance + High Potential” (Top Right)
- Yellow for “Moderate Zones”
- Red for “Low Performance + Low Potential” (Bottom Left)
Use the “Fill Color” bucket on the Home tab to do this manually for each box.
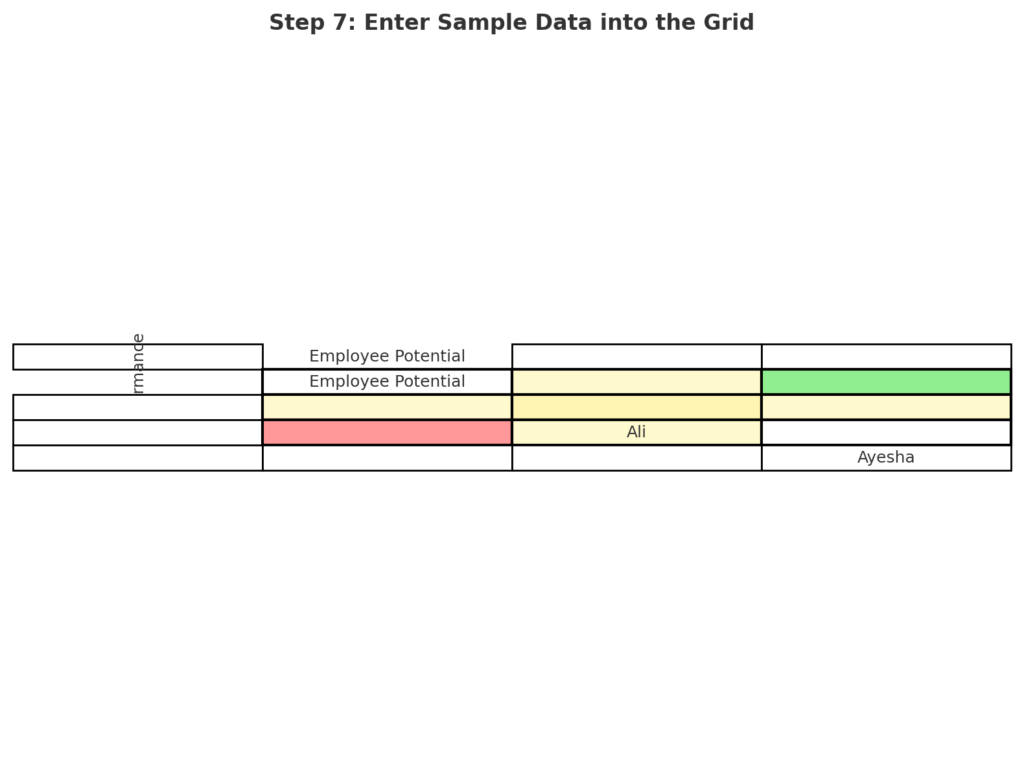
Step 7: Enter Sample Data or Comments
You can enter employee names, IDs, or comments into each box manually based on evaluations.
For example:
- In D2 (High Performance, High Potential): Enter “Ayesha”
- In C3 (Moderate Performance, Moderate Potential): Enter “Ali”
This makes it functional for real-world applications.
Tips and Best Practices
- Keep It Clean and Balanced: Use equal row heights and column widths so each of the 9 boxes looks like a perfect square. This improves visual balance and makes it easier to read during presentations or evaluations.
- Add Notes Without Clutter: Instead of filling boxes with too much text, use Excel’s comment feature. Right-click a cell → Insert Comment → add details like strengths or improvement plans.
- Protect Your Grid Layout: Once your grid is set, lock the structure using Excel’s “Protect Sheet” feature. This prevents others from changing your layout or colors when they update data.
- Create a Legend and Title: Always add a small legend to explain the colors or labels. Give your grid a clear title, like “Q2 Performance vs. Potential Matrix.” This adds context and looks professional.
9 box grid – talent mapping – Excel for HR People – Template & Explanation video
Easy-to-Use 9 Box Solutions
If you’re short on time or prefer not to build from scratch, there are several ready-made 9 Box Grid templates available online that can be customized for your business needs. These templates are usually built in Excel or Google Sheets and come with pre-formatted boxes, color-coded categories, and editable labels.
You can simply download, plug in your employee data, and start evaluating right away. Many also include automated features like dropdowns and scoring formulas for faster placement.
Frequently Asked Questions (FAQs)
What is the main use of a 9 Box Grid in Excel?
The 9 Box Grid helps assess talent and plan for succession. It does this by showing performance and potential.
Can I use Excel formulas to automate the grid?
Yes! You can use IF, VLOOKUP, or dropdowns to auto-place names based on ratings.
Is the 9 Box Grid limited to HR use?
No. You can use it for product evaluation, marketing analysis, or risk assessment. It works whenever you need to sort two axes of criteria visually.
Can I create a dynamic version of the 9 Box Grid in Excel?
Yes. You can create an interactive grid in Excel. Use tables, dropdowns, and conditional formatting. The grid will update when you change ratings.
Conclusion
Making a 9 Box Grid in Excel is a useful skill. It helps improve decision-making in performance and talent management. It blends clarity, structure, and flexibility into a tool you use every day. This grid helps managers, HR specialists, and consultants better map and strategize around their people. Follow this guide and use the visuals. You’ll save time and improve how you understand and show talent data.