
In data analysis and statistics, it’s important to know how much a data point differs from the average. A great way to measure this is with the Z Score. It’s a simple but very helpful statistical tool. If you’re a student checking exam scores, a business owner reviewing performance, or a data analyst working with big data, learning to calculate the Z Score in Excel can save time and improve accuracy. Let’s break it down step by step.
What is a Z Score?
A Z Score (also known as a standard score) tells you how many standard deviations a value is from the mean of a dataset.
Formula: Z = (X – μ) / σ Where:
- X = value
- μ (mu) = mean of the dataset
- σ (sigma) = standard deviation
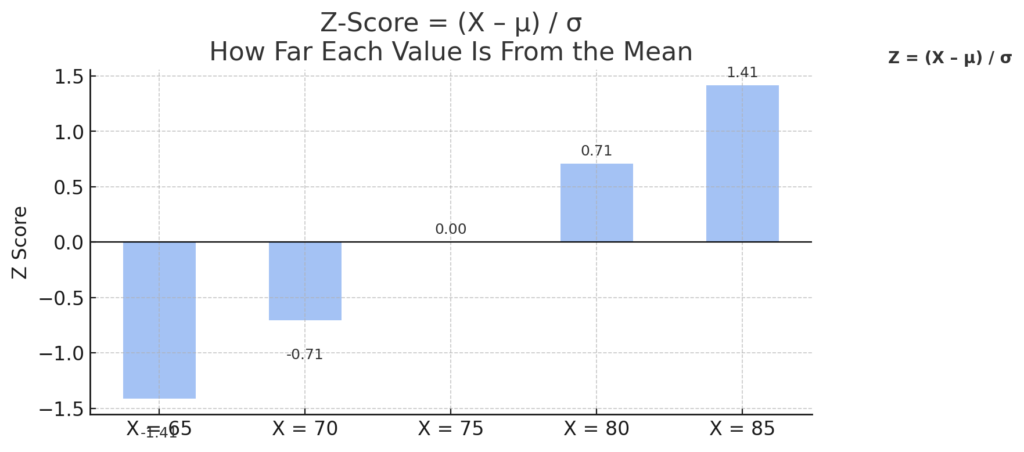
A Z Score helps identify how typical or extreme a data point is within a dataset.
- A Z Score of 0 means the value is exactly average.
- A positive Z Score indicates the value is above the mean.
- A negative Z Score indicates it’s below the mean.
Where Does Z Score Apply in Our Everyday Life?
The concept of Z Scores isn’t just for statisticians. Here are common ways it shows up in everyday routines:
Education
In schools and universities, Z Scores help compare a student’s performance to the whole class. Educators and analysts can use Z Scores to see how a student’s performance compares to the average. This method goes beyond just looking at raw scores.
Example: If a student scored 85 on a math test and the class average was 70 with a standard deviation of 10, the Z Score would be +1.5. The student scored 1.5 standard deviations above average. This shows strong performance.
Fitness and Health
Z Scores help compare a person’s body measurements to the average in a population. They are commonly used in health assessments. Doctors and health professionals use these tools to check BMI (Body Mass Index), bone density, and other health signs.
Example: A child’s growth chart may show a height-for-age Z Score of -2. This means the child is two standard deviations below the average height for their age group. Such a score might raise concerns about their growth.
Finance and Investments
In finance, Z Scores show unusual changes in stock prices or returns. Traders and analysts use them to spot volatility. They also create models for risk management.
Example: A stock with a Z Score of +3 shows it’s three standard deviations above the mean. This might mean a rare event, which could point to an opportunity or a risk.
Medical Testing
Medical laboratories often use Z Scores to interpret test results. It helps clinicians see if a patient’s result is normal or if it’s very abnormal.
Example: In a bone density scan (DEXA), a Z Score compares a person’s bone mass to what’s expected for their age and sex. A very low Z Score might indicate osteoporosis or other bone health issues.
When Do You Need the Z Score?
You should consider using Z Scores when:
- You want to standardize values from different datasets
- You’re detecting outliers or anomalies
- You’re working on normal distribution analysis
- You’re comparing data that has different units or scales
Z Scores help clarify what raw numbers can hide. They are useful for comparing performance or spotting deviations.
How to Calculate the Z Score in Excel (Step-by-Step Guide)
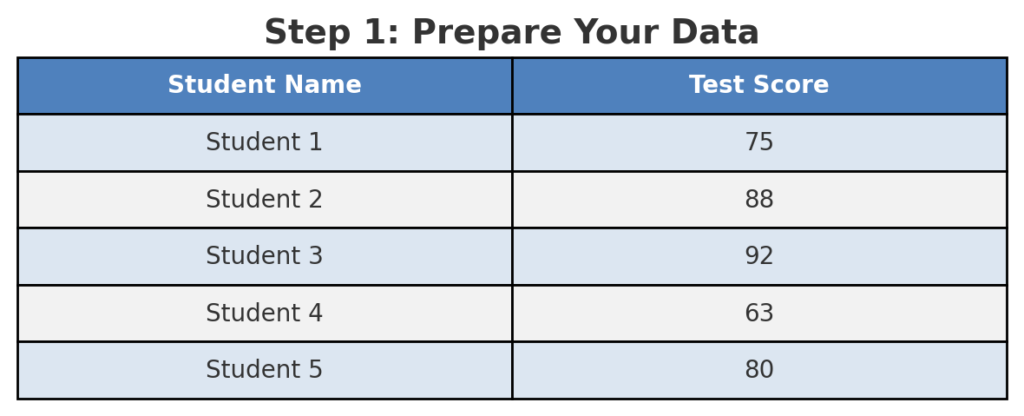
Let’s say you have a list of student test scores in Excel, and you want to calculate the Z Score for each student.
Step 1: Prepare Your Data
- Column A: Student names
- Column B: Test scores
Example:
A | B
———–|———
Student 1 | 75
Student 2 | 88
Student 3 | 92
Student 4 | 63
Student 5 | 80
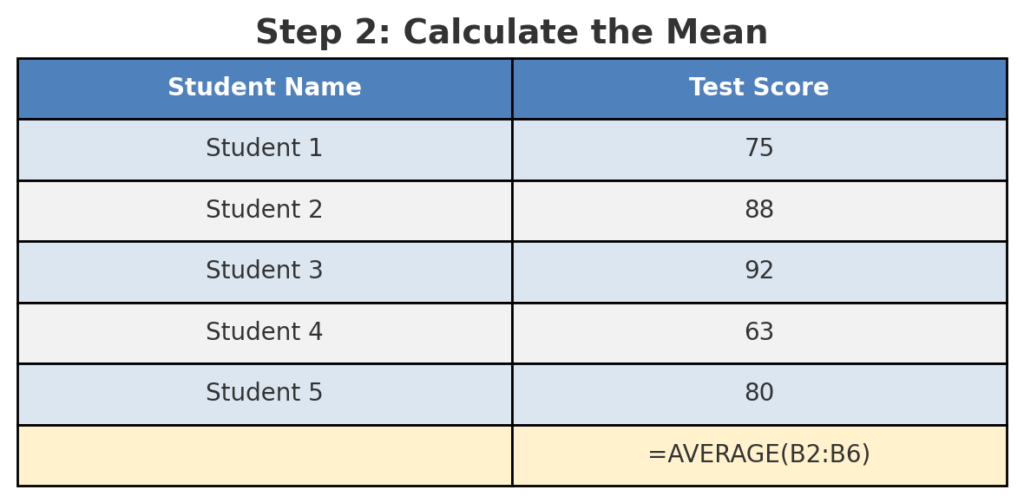
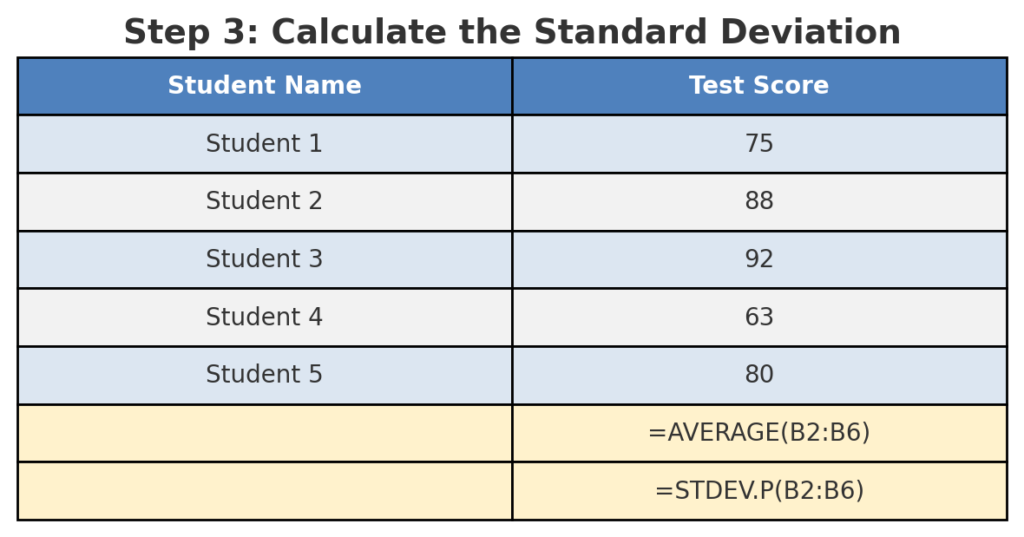
Step 2: Calculate the Mean
In a new cell (e.g., B7), enter:
- =AVERAGE(B2:B6)
Step 3: Calculate the Standard Deviation
In B8, enter:
- =STDEV.P(B2:B6)
Use STDEV.P for population, or STDEV.S for a sample.
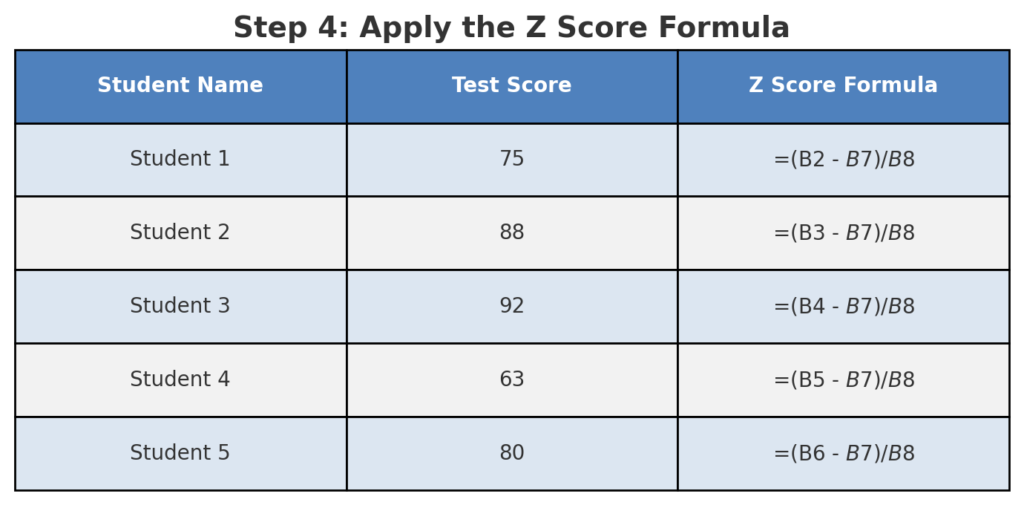
Step 4: Apply the Z Score Formula
In Column C (C2), enter the Z Score formula:
- =(B2 – $B$7) / $B$8
Drag this formula down for all rows.
Step 5: Format the Z Scores (Optional)
Use the Format Cells option to limit decimals for easier readability.
Now, you have the Z Scores calculated for each test score!
How To Calculate Z Scores In Excel
Frequently Asked Questions
Can Excel automatically calculate Z Scores?
You can’t do it directly, but you can use the built-in formulas AVERAGE() and STDEV.P(). They let you compute them easily with your own formula.
What’s the difference between STDEV.P and STDEV.S?
- STDEV.P calculates population standard deviation.
- STDEV.S calculates sample standard deviation. Choose based on whether your data represents a full population or a sample.
Can I use Z Scores for skewed data?
Z Scores assume a normal distribution. For skewed datasets, results may not be meaningful without transformation.
What is a high or low Z Score?
A Z Score > +2 or < -2 is often considered unusual or an outlier, depending on context. In quality control, finance, or health sectors, thresholds may differ.
Conclusion
Understanding how to calculate Z Score in Excel is a valuable skill across many fields. It helps you standardize your data, spot anomalies, and compare different metrics effectively. Excel helps you quickly analyze sales numbers, test results, or health stats. You can compute Z Scores easily with basic formulas.