

In the busy world of data analysis, Microsoft Excel offers users strong tools. These tools are designed for both ease of use and speed. One feature is the Quick Analysis Tool. It saves time by turning raw data into visual insights in just a few clicks. This tool can make your work easier. It helps with budgets, tracks sales, and analyzes trends.
What Is the Quick Analysis Tool in Excel?
The Quick Analysis Tool in Excel is a handy feature. It shows up automatically when you select a data range. It provides instant access to commonly used data analysis features like:
- Conditional Formatting
- Charts
- Tables
- Sparklines
- Totals
Users can quickly preview and apply formatting right from the selected data range. They can also create visualizations without switching through multiple tabs in the ribbon.
This tool is great for beginners who aren’t used to advanced Excel functions. It helps analysts and professionals gain quick insights. It also ensures data quality and clear presentation.
How to Turn On / Off the Quick Analysis Tool in Excel?
The Quick Analysis Tool is usually on by default in recent Excel versions. You can easily turn it on or off to suit your needs.
To Enable Quick Analysis Tool:
- Open Excel and click on File → Options.
- In the Excel Options dialog box, select General.
- Scroll down to the User Interface options section.
- Check the box that says “Show Quick Analysis options on selection.”
- Click OK to save your changes.
To Disable Quick Analysis Tool:
Follow the same steps, but uncheck the box mentioned in step 4.
This flexibility helps you keep your workspace tidy. You can access powerful shortcuts whenever you need them.
How to Use Quick Analysis Tool in Excel?
Using the Quick Analysis Tool is incredibly intuitive. Here’s a step-by-step breakdown of how to make the most of it:
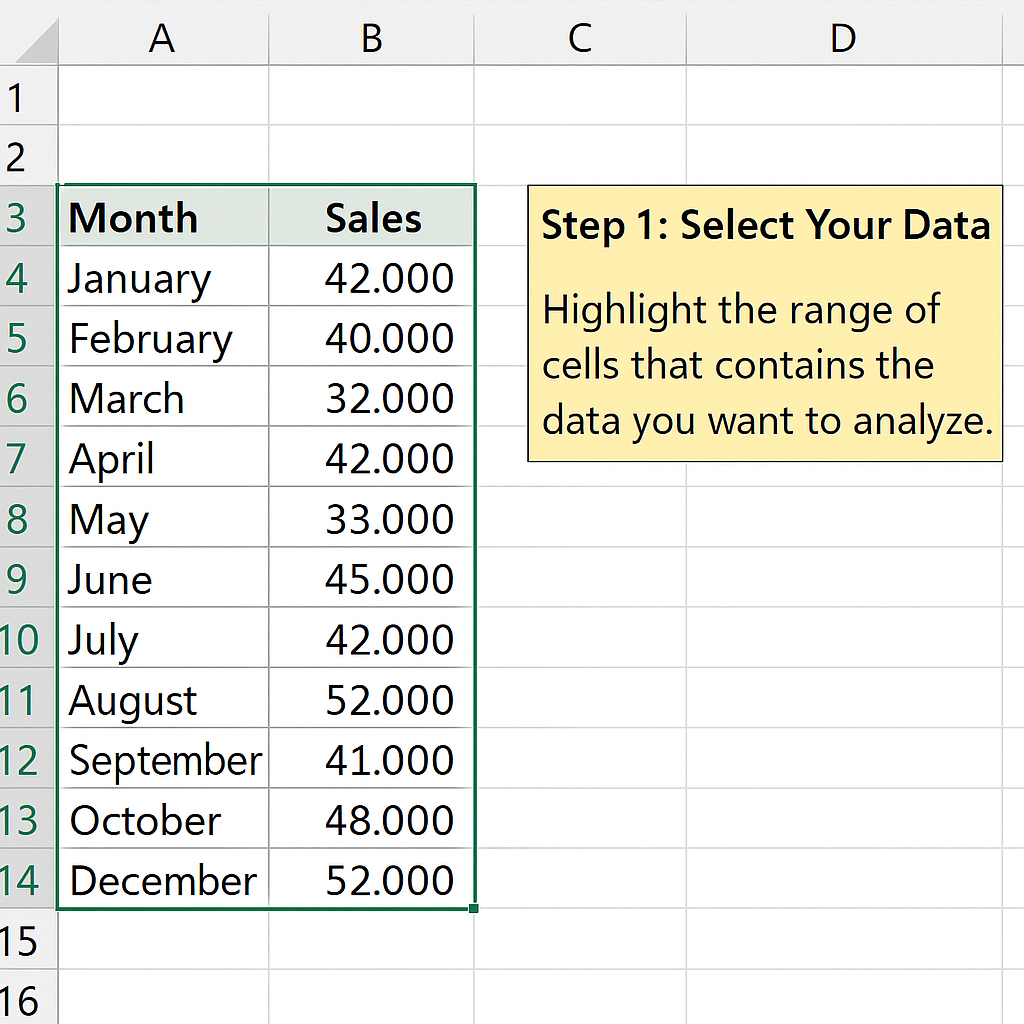
Step 1: Select Your Data
Highlight the range of cells that contains the data you want to analyze. For example, a list of monthly sales figures or expenses.
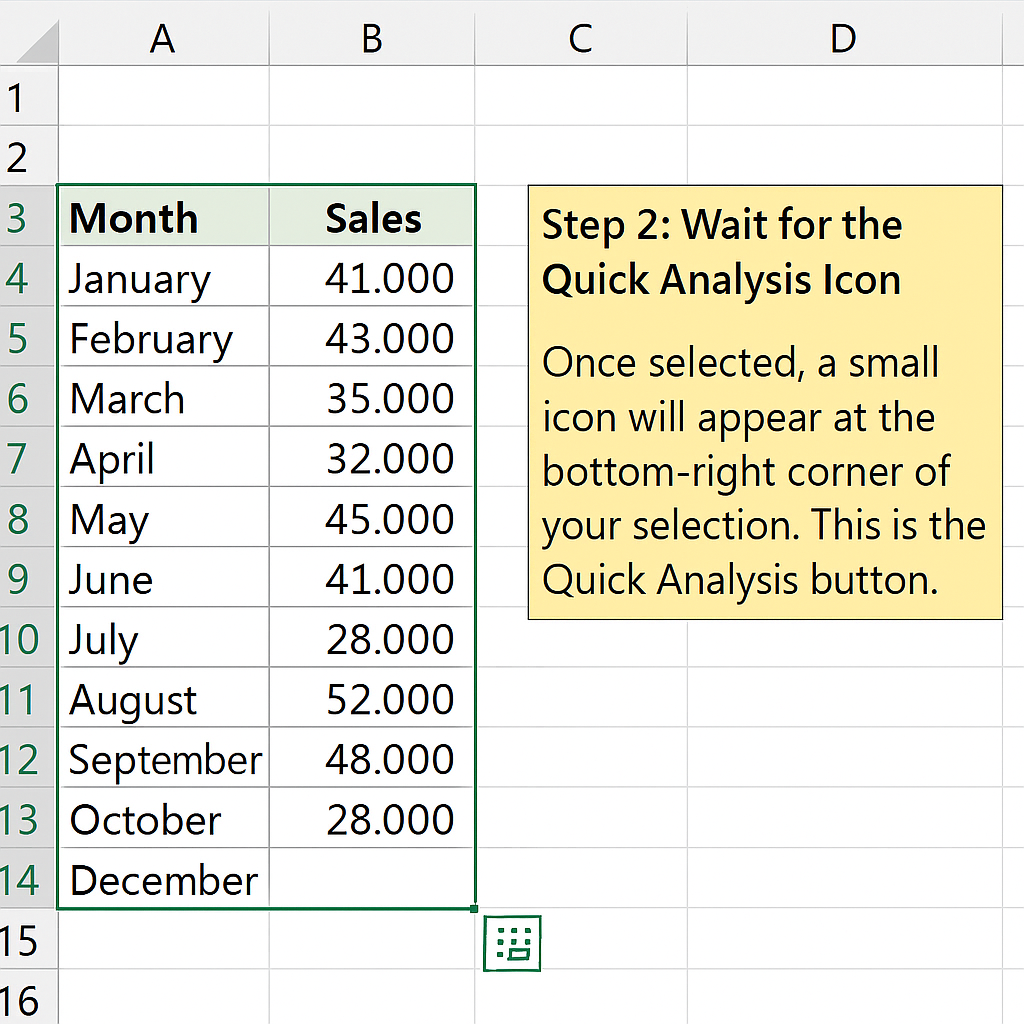
Step 2: Wait for the Quick Analysis Icon
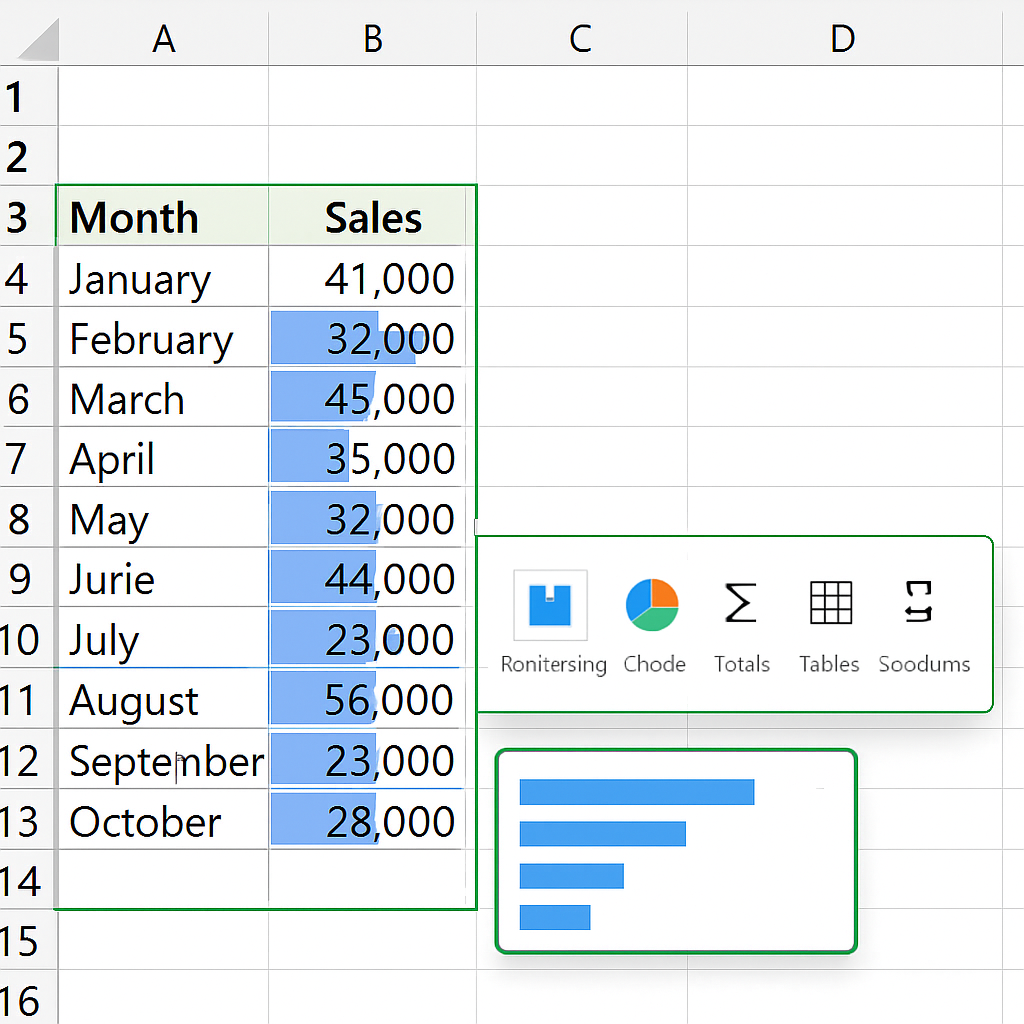
Once selected, a small icon will appear at the bottom-right corner of your selection. This is the Quick Analysis button.
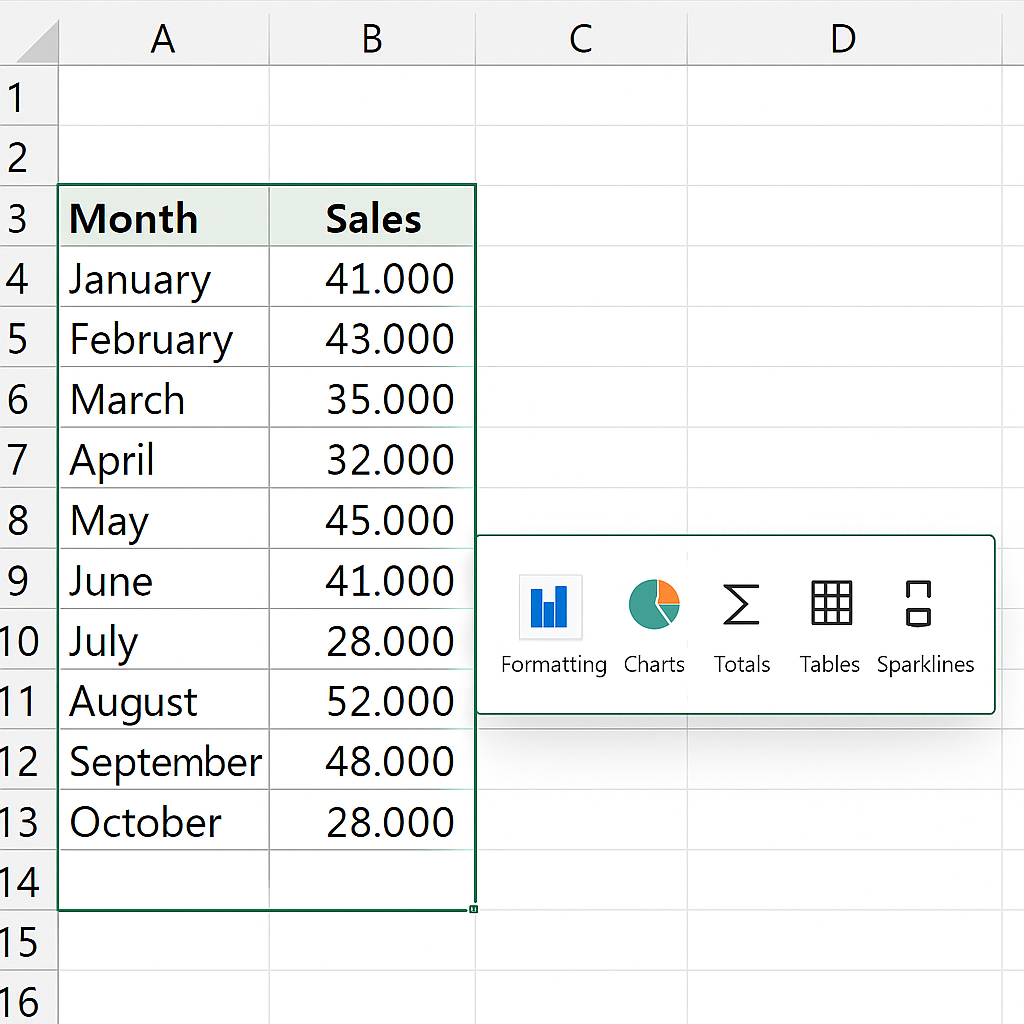
Step 3: Click the Icon
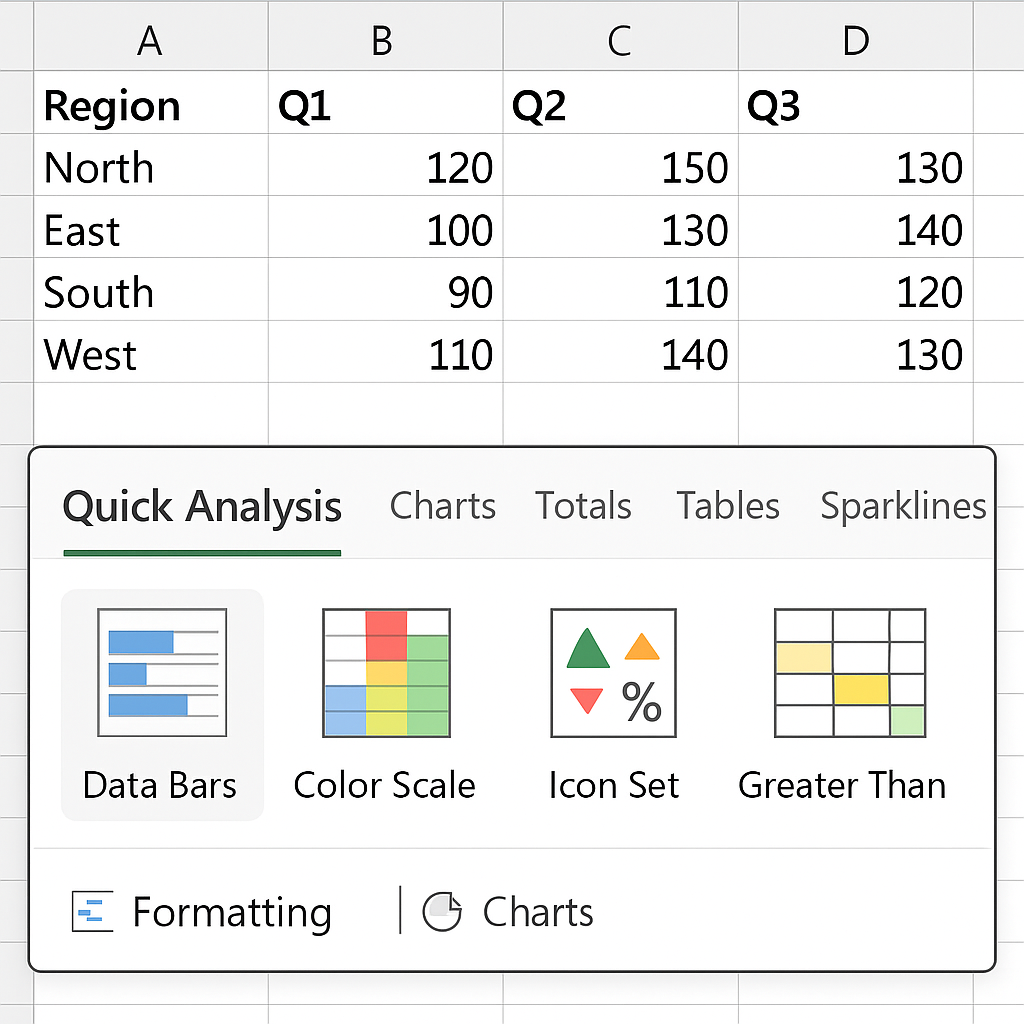
Clicking this button opens a pop-up menu divided into five categories:
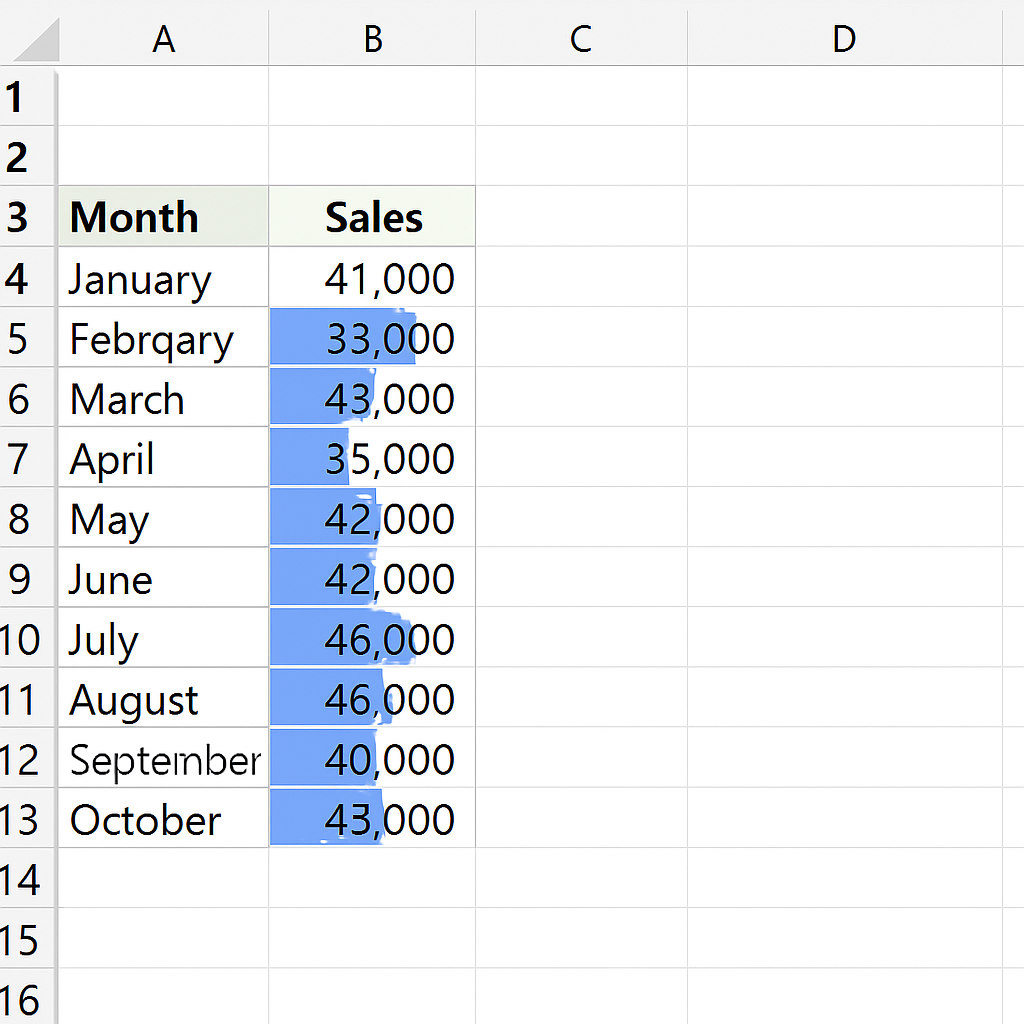
- Formatting – Use conditional formatting like data bars, color scales, or icon sets to highlight trends.
- Charts – Instantly create pie charts, line charts, bar charts, and more to visualize the data.
- Totals – Quickly calculate the sum, average, count, % total, and running total without manually writing formulas.
- Tables – Convert your selection into a structured table with filtering and sorting capabilities.
- Sparklines – Add tiny line graphs inside cells to show trends at a glance.
Step 4: Hover to Preview
Before clicking, you can hover over each option to see a live preview of how it will affect your data.
Step 5: Click to Apply
Once you find the feature you want to use, simply click it. Excel applies the formatting or inserts the element instantly.
Benefits of the Quick Analysis Tool in Excel (In Detail)
Here are some in-depth benefits of this versatile Excel feature:
Accelerated Data Analysis
The Quick Analysis Tool saves time. It helps you skip the ribbon and forget about memorizing formulas. Users can create summaries, charts, and visuals in seconds. This feature is perfect for quick reports and exploring data in real time.
Intuitive for Beginners
For those who are not Excel experts, this tool removes the steep learning curve. It gives casual users professional-level tools. It offers prebuilt options, so there’s no need for coding or writing formulas.
Error Reduction
Manual formulas often introduce errors, especially in complex datasets. The Quick Analysis Tool provides automatic setups that are already checked. This cuts down on calculation errors and boosts data reliability.
Instant Visualization
Data visualizations enhance communication. This tool lets you see live previews of charts and graphs. It helps users spot trends, patterns, or outliers quickly. No need to wait for a data scientist to interpret the numbers.
Limitations of the Quick Analysis Tool
Despite its usefulness, the Quick Analysis Tool does have certain limitations:
- Limited Customization: The tool is good for basic visuals and calculations. However, it doesn’t offer the depth or flexibility found in custom formulas, charts, or pivot tables.
- Not Available in Older Excel Versions: The feature is only available in Excel 2013 and later. Users with older versions won’t have access. This could limit collaboration in organizations using legacy systems.
- Not Suitable for Complex Analysis: Quick Analysis can’t replace Excel’s advanced functions, VBA scripts, or Power Query tools for financial modeling, simulations, or predictive analytics.
- Visual Overload Risk: New users may use too many formatting options. This can create cluttered visuals that confuse instead of clarify.
Frequently Asked Questions (FAQ’s)
Is the Quick Analysis Tool available in Excel Online?
No, by 2025, the Quick Analysis Tool is only in desktop versions of Excel. It starts with Excel 2013 and newer.
Can I customize the options shown in the Quick Analysis menu?
Not directly. The tool offers preset features. For customized outputs, you would need to use Excel’s full suite of tools manually.
Why can’t I see the Quick Analysis icon when I select data?
Make sure you have enabled the tool under File → Options → General. Also, ensure your data is in a contiguous range without merged or empty cells.
Can I undo a Quick Analysis action?
Just press Ctrl + Z right after using the feature, or click the Undo button to go back.
Conclusion
The Quick Analysis Tool in Excel helps both new and skilled users. It makes understanding data easier and speeds up getting insights. In just a few clicks, you can boost your dataset. Add professional visuals and summaries easily. No advanced Excel skills are needed! Using this tool wisely can improve your productivity. It also helps cut down on mistakes and makes your data presentations better. It’s important to know its limits. Also, be ready to use advanced Excel features for more detailed analysis when needed.