
Employee turnover is an important HR metric. It shows how often employees leave and are replaced in a company. A high turnover rate can show bigger problems. These might include a poor workplace culture, low engagement, or uncompetitive pay. This guide shows you how to calculate employee turnover in Excel. It uses simple formulas and gives detailed examples. You’ll learn to analyze and reduce turnover based on data.
What is Employee Turnover?
Employee turnover is how often workers leave a company and get replaced by new ones in a set time frame. It includes both voluntary exits (resignations) and involuntary exits (terminations, layoffs).
Types of Employee Turnover:
- Voluntary Turnover – Employees who leave on their own (e.g., for another job or personal reasons).
- Involuntary Turnover – Employees terminated or laid off due to performance or restructuring.
- Internal Turnover – Employees moving from one role or department to another within the organization.
Understanding turnover helps organizations spot HR problems, boost retention strategies, and lower rehiring and training costs.
How to Calculate Employee Turnover in Excel?
You can calculate turnover using a simple formula:
Employee Turnover Rate (%) = (Number of Employees Who Left / Average Number of Employees) * 100
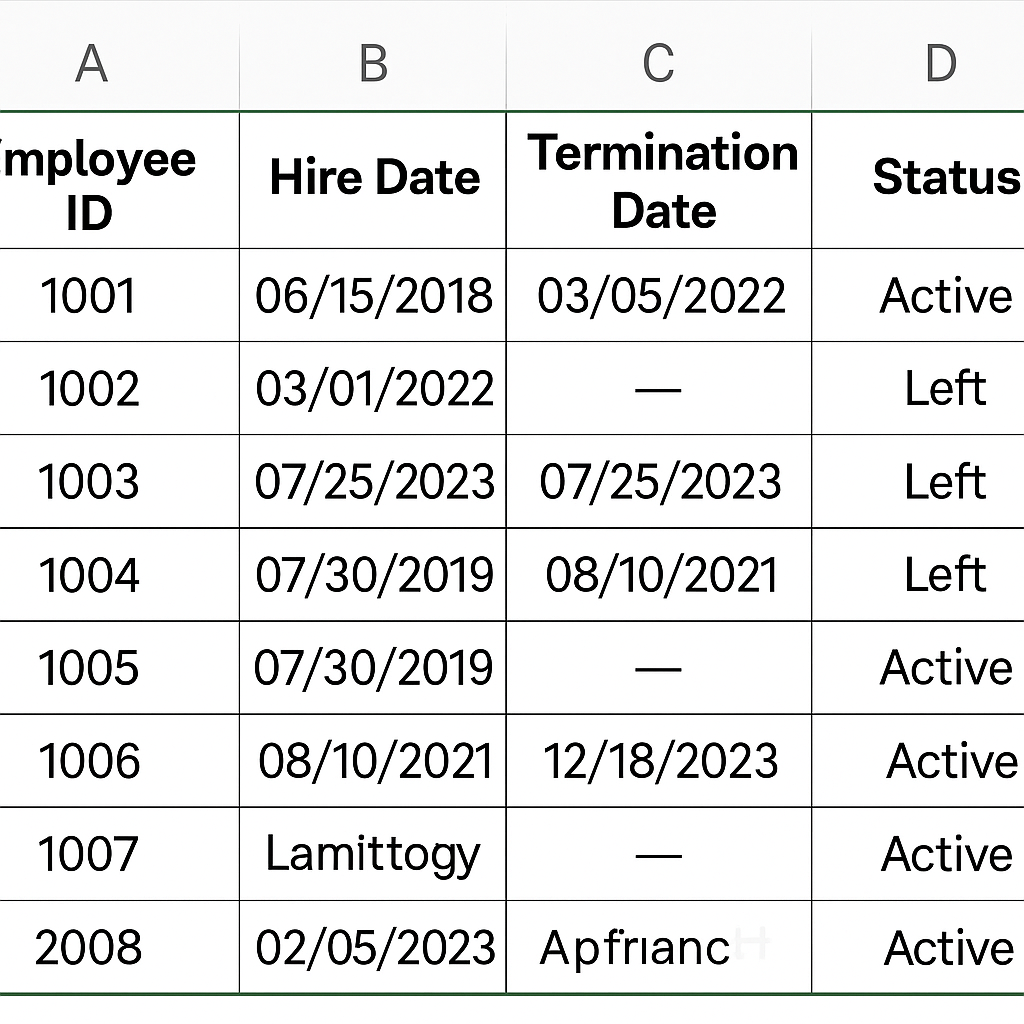
Step 1: Create a data table
Create a data table with the following columns:
- Employee ID
- Hire Date
- Termination Date
- Status (Active or Left)
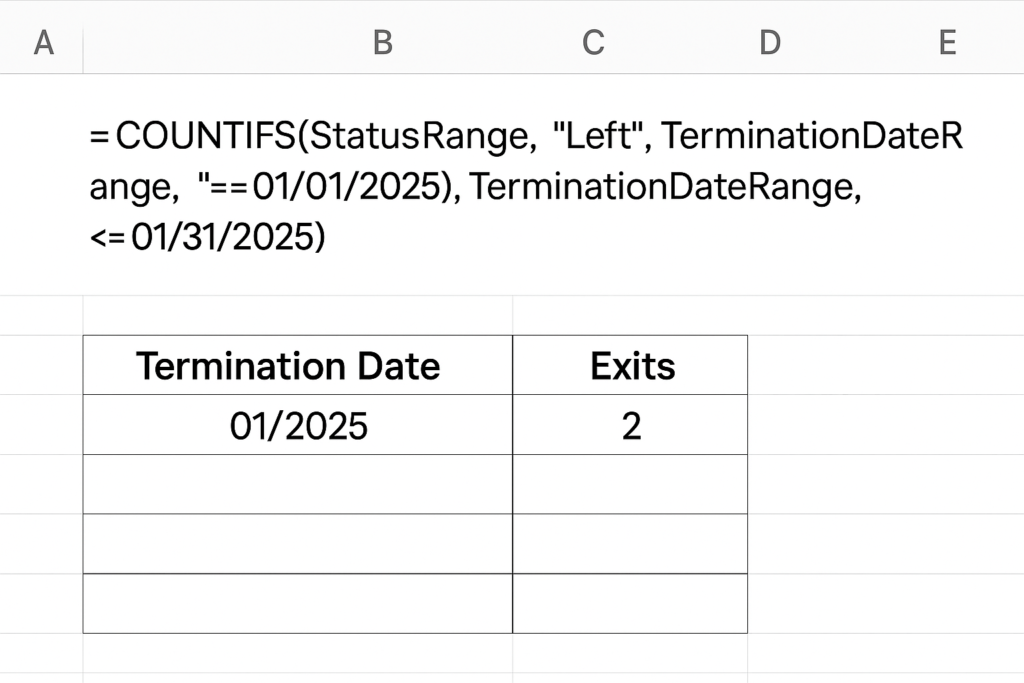
Step 2: Calculate Monthly/Quarterly Exits
Use COUNTIFS to count employees who left in a specific period:
=COUNTIFS(StatusRange, “Left”, TerminationDateRange, “>=01/01/2025”, TerminationDateRange, “<=01/31/2025”)
Step 3: Calculate Average Number of Employees
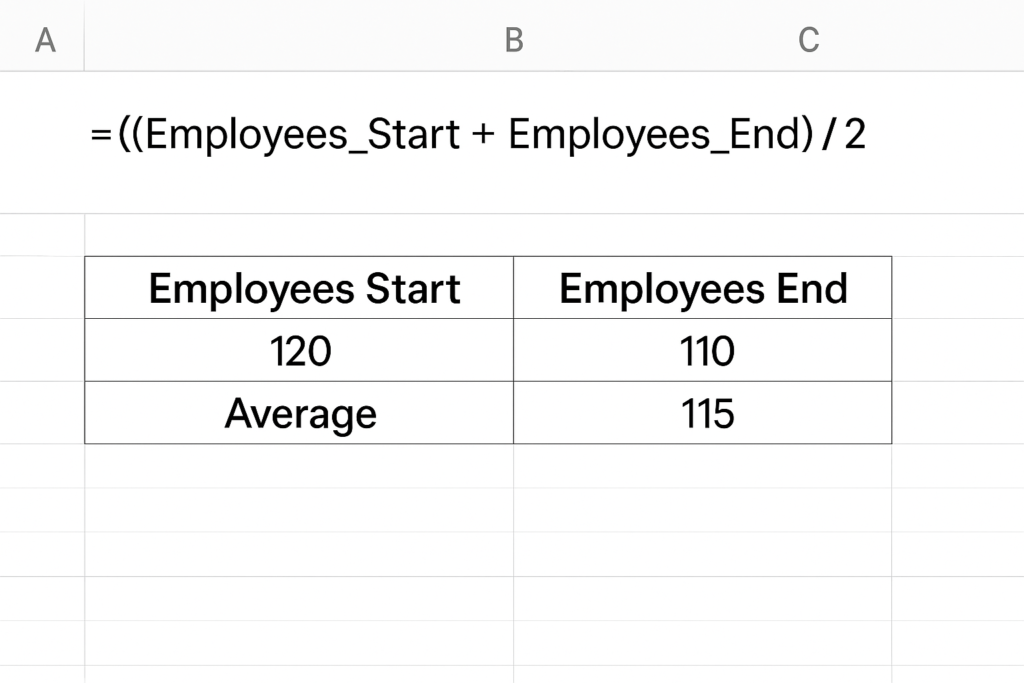
Add the number of employees at the start and end of the period, then divide by 2:
= (Employees_Start + Employees_End) / 2
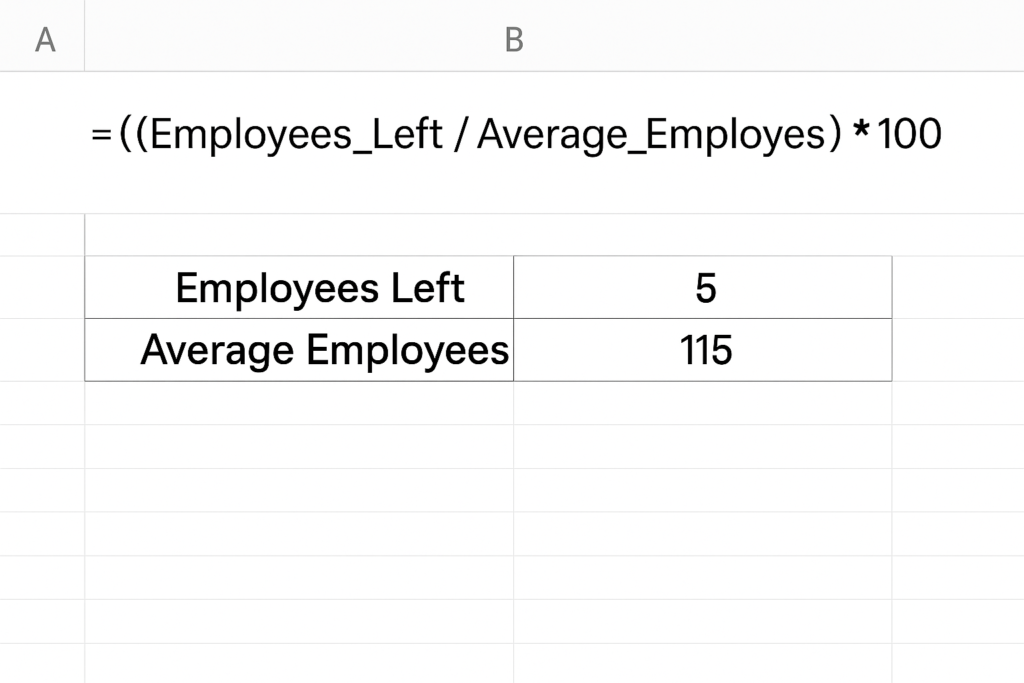
Step 4: Apply the Turnover Rate Formula
= (Employees_Left / Average_Employees) * 100
Step 5: (Optional)Use Pivot Tables or Charts
Use pivot charts to see turnover trends by month, department, or employee category. This helps you make better decisions.
Example: Calculating Monthly Turnover in Excel
Let’s say:
- Employees at start of Jan 2025: 120
- Employees at end of Jan 2025: 130
- Employees who left in Jan 2025: 10
Average Employees = (120 + 130) / 2 = 125 Turnover Rate = (10 / 125) × 100 = 8%
This 8% monthly turnover may be high depending on your industry. HR should investigate causes like poor job satisfaction or managerial issues.
Benefits of Calculating Employee Turnover
Understanding and tracking turnover in Excel offers several strategic advantages:
Cost Management
High turnover costs a lot. Recruiting, onboarding, and training new employees take time and money. Calculating turnover helps budget for hidden HR costs. It also shows which departments have high churn rates.
Workforce Planning
Tracking turnover helps HR predict hiring needs. It allows for adjustments in staffing plans. This reduces the risk of being understaffed during important times.
Identify Problem Areas
High turnover in a specific team or manager could point to leadership or cultural issues. Excel data lets you segment turnover by team, role, or tenure.
Improve Employee Retention
By correlating turnover with employee feedback, survey results, or performance data, HR can create targeted retention strategies like improving onboarding or offering competitive benefits.
Better HR Reporting
Using Excel enhances the quality of HR dashboards and presentations. Decision-makers get real-time visibility into staff dynamics without needing advanced software.
Support Compliance & Audit
Accurate turnover tracking supports reporting for regulatory compliance and internal audits, especially in industries with mandatory staffing ratios.
How to calculate Employee Turnover in Excel – Office 365
Frequently Asked Questions (FAQ’s)
What is a good employee turnover rate?
A turnover rate of 10% or lower is considered healthy in most industries. However, rates vary by sector. For example, retail and hospitality typically experience higher turnover than finance or tech.
Can Excel track turnover by department?
Yes. If your Excel sheet has a “Department” column, use a Pivot Table. This will help you find turnover rates for each department.
How often should I calculate employee turnover?
Monthly for tracking trends.
Quarterly for strategic reviews.
Annually for performance evaluations or reporting.
Is Excel sufficient for large organizations?
Excel is great for small to mid-sized businesses. But for large companies with many employees, dedicated HR software can provide better automation and integrations.
What other metrics should I track with turnover?
Track time to hire, retention rate, employee engagement score, and exit reasons. Do this alongside turnover.
Conclusion
Tracking employee turnover in Excel helps HR teams monitor workforce stability. A few formulas and organized data can reveal insights. These insights help cut attrition, boost engagement, and save money. In today’s job market, managing employee turnover is crucial. It’s not just an option; it’s a key strategy. High turnover can disrupt productivity, drain financial resources, and damage organizational morale. Learning to calculate employee turnover in Excel helps HR professionals and business owners. They can measure workforce changes, find issues early, and make informed choices. This boosts employee satisfaction and retention.