

In today’s data-driven world, it’s important to understand how two variables relate. This knowledge matters in many areas like finance, marketing, healthcare, and education. The correlation coefficient measures relationships between variables. Microsoft Excel provides easy tools to calculate it quickly and accurately. This guide will explain the correlation coefficient. You will learn how to calculate it using various Excel methods. We’ll also share real-world examples and discuss its benefits.
What is a Correlation Coefficient?
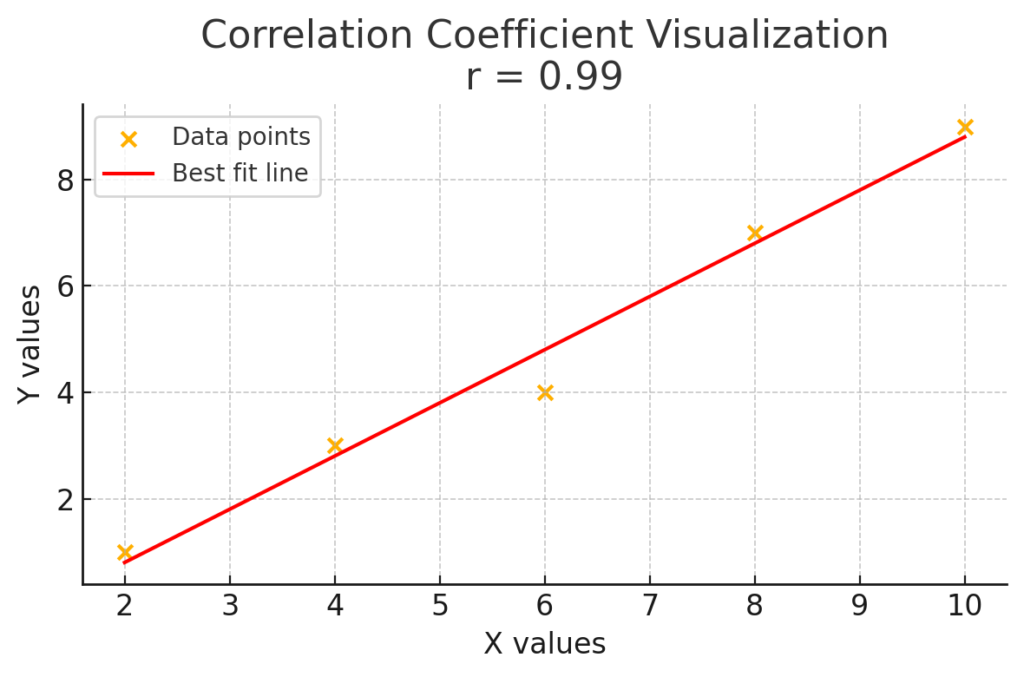
The correlation coefficient, or r, measures how strongly two variables are related. It shows both the strength and direction of their linear relationship.
Key Characteristics:
- Range: -1 to +1
- +1: Perfect positive correlation
- 0: No correlation
- -1: Perfect negative correlation
- Type: Most commonly, the Pearson correlation coefficient is used in Excel.
Use Cases:
- Determine the relationship between advertising spend and sales
- Analyze stock price movement correlations
- Study health indicators like calorie intake and body weight
Understanding this metric helps in predictive analysis, trend detection, and informed decision-making.
How to Calculate Correlation Coefficient in Excel?
Excel has several ways to calculate correlation coefficients. You can use formulas or built-in tools, depending on what you prefer.
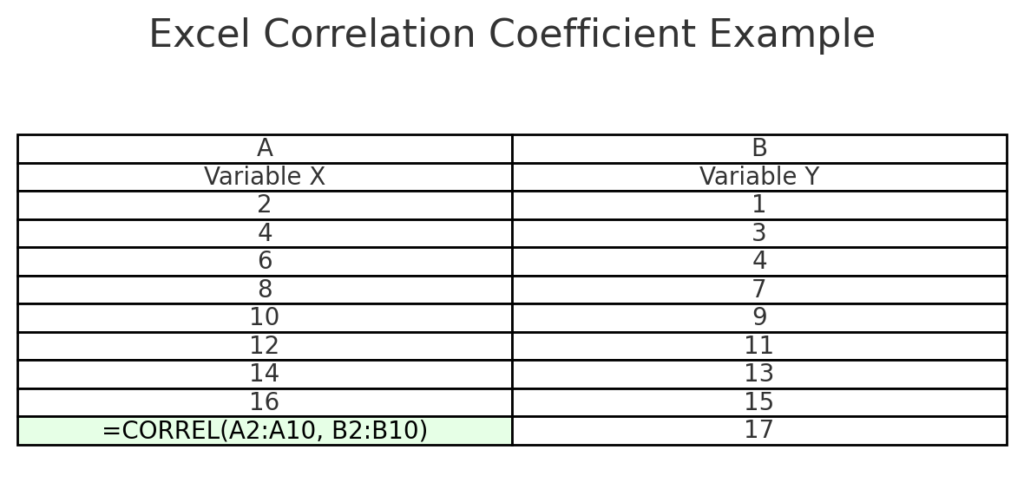
Method 1: Using the =CORREL() Function
The easiest and most commonly used method:
Steps:
- Enter your data in two columns. Example: A2:A10 for Variable X, B2:B10 for Variable Y
- Click on an empty cell.
- Type the formula:
=CORREL(A2:A10, B2:B10) - Press Enter.
Excel will return the Pearson correlation coefficient.
Method 2: Using the Data Analysis Toolpak
For a more detailed correlation matrix.
Steps:
- Click File > Options > Add-ins.
- In the “Manage” box, select Excel Add-ins, and click Go.
- Check Analysis Toolpak and click OK.
- Go to Data > Data Analysis > Correlation.
- Select the input range (both columns of data).
- Choose Grouped by Columns and check Labels in First Row if applicable.
- Click OK.
Excel will display a correlation matrix in a new sheet.

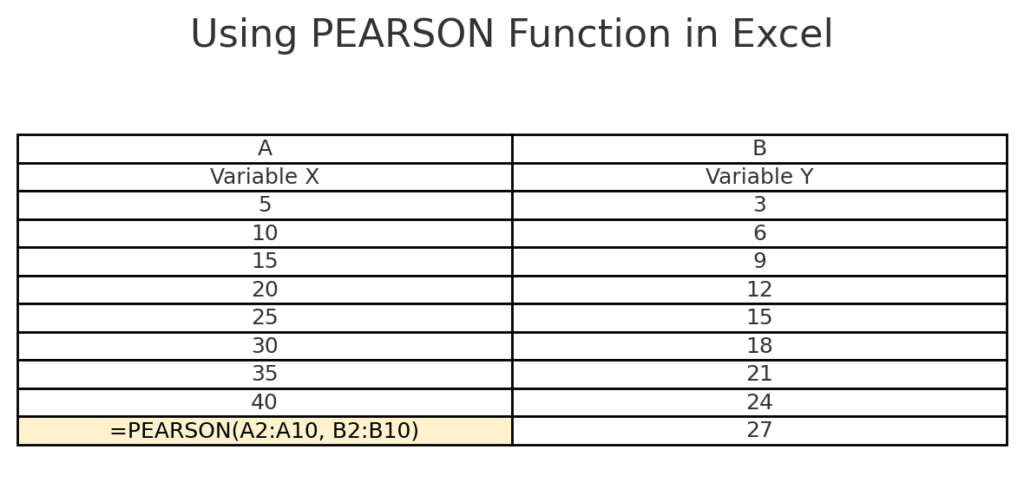
Method 3: Using the =PEARSON() Function
This function also returns the Pearson correlation coefficient.
=PEARSON(A2:A10, B2:B10)
It functions similarly to =CORREL(), but is more statistical in nature.
Real-World Examples
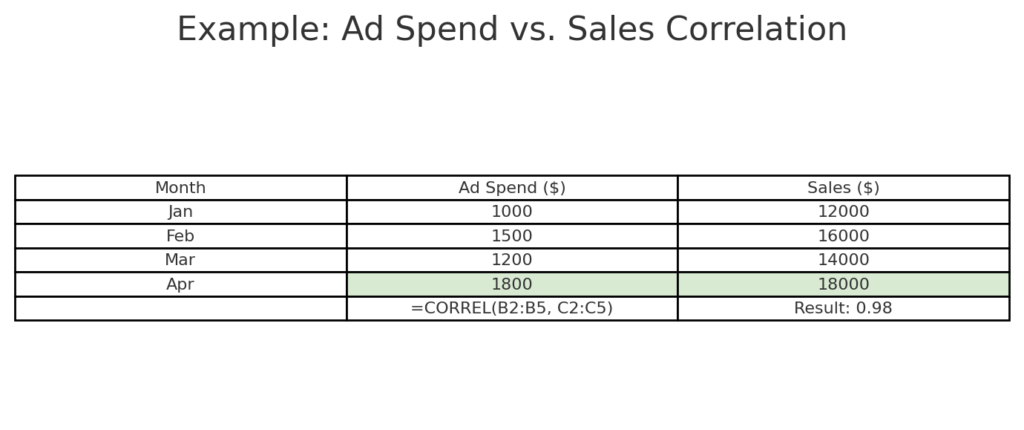
Example 1: Advertising Spend vs. Sales
MonthAd Spend ($)Sales ($)Jan1,00012,000Feb1,50016,000Mar1,20014,000Apr1,80018,000
Formula: =CORREL(B2:B5, C2:C5) Result: 0.98 (strong positive correlation)
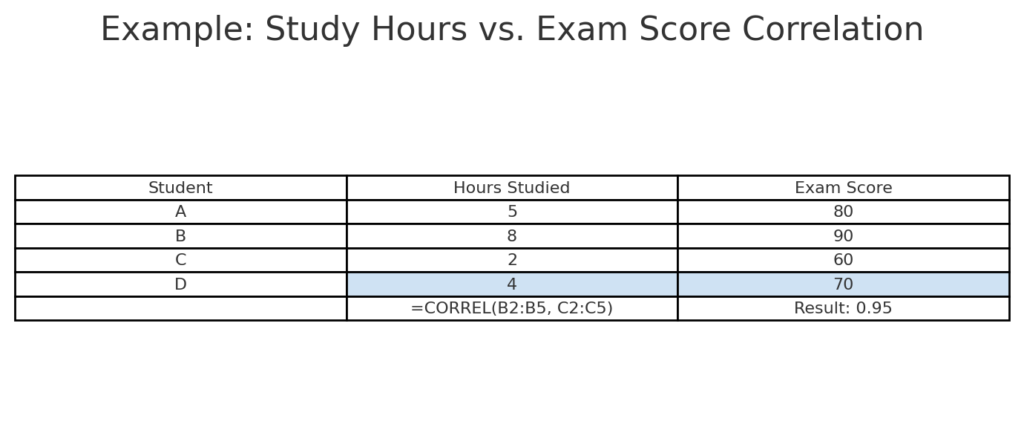
Example 2: Study Hours vs. Exam Score
StudentHours StudiedExam ScoreA580B890C260D470
Formula: =CORREL(B2:B5, C2:C5) Result: 0.95 (strong positive correlation)
Benefits of Calculating Correlation Coefficient in Excel
Quick and Accurate Analysis
Excel’s built-in functions let you quickly calculate correlation coefficients, even with big datasets.
Use Case: Financial analysts comparing asset price movements.
No Complex Statistics Needed
Excel does the math for you, even if you’re not a statistician. There are no manual formulas and no chance for errors.
Use Case: Marketers testing campaign performance vs. leads generated.
Visual Data Representation
Using correlation analysis and scatter plots in Excel gives a clear visual of relationships.
Use Case: Students comparing lab results and observations.
Customizability
You can create dashboards that update correlation values automatically when new data comes in.
Use Case: Sales teams tracking correlations between outreach efforts and closed deals.
Scalable for Business Use
Excel can handle both small and large datasets. This makes it great for businesses, researchers, and consultants.
Use Case: Healthcare professionals analyzing correlations between symptoms and lab values.
Using Excel to calculate a correlation coefficient || interpret relationship between variables
Frequently Asked Questions (FAQ’s)
What’s the difference between CORREL and PEARSON in Excel?
Both return the Pearson correlation coefficient. They’re functionally the same for most users.
Can Excel calculate non-linear correlation?
No. Excel’s CORREL() and PEARSON() only calculate linear correlation. For non-linear relationships, regression analysis or other tools are recommended.
What does a correlation of 0 mean?
It indicates no linear relationship between the two variables.
Can I calculate correlation for more than two variables?
You can use the Data Analysis Toolpak to find correlations. Just select Correlation, and you can create a matrix that compares multiple columns.
Is correlation the same as causation?
No. Correlation shows association, not cause and effect.
Conclusion
Calculating the correlation coefficient in Excel is key for data analysis. It helps with decision-making and performance evaluation. Excel helps students, researchers, and professionals find relationships in data. You can use simple formulas like =CORREL() and tools such as the Data Analysis Toolpak. Understanding correlation helps in forecasting trends, optimizing strategies, and gaining actionable insights.