

To track performance and see progress, focus on one key metric: growth percentage. Calculating growth percentage is key. It shows your monthly revenue, yearly sales, social media activity, and academic results. Excel, being the most widely used data tool, makes this task quick and efficient. This guide will explain growth percentage. We’ll show you how to calculate it in Excel. You’ll find step-by-step examples and learn about real-world benefits. We’ll also answer common questions.
What is Growth Percentage?
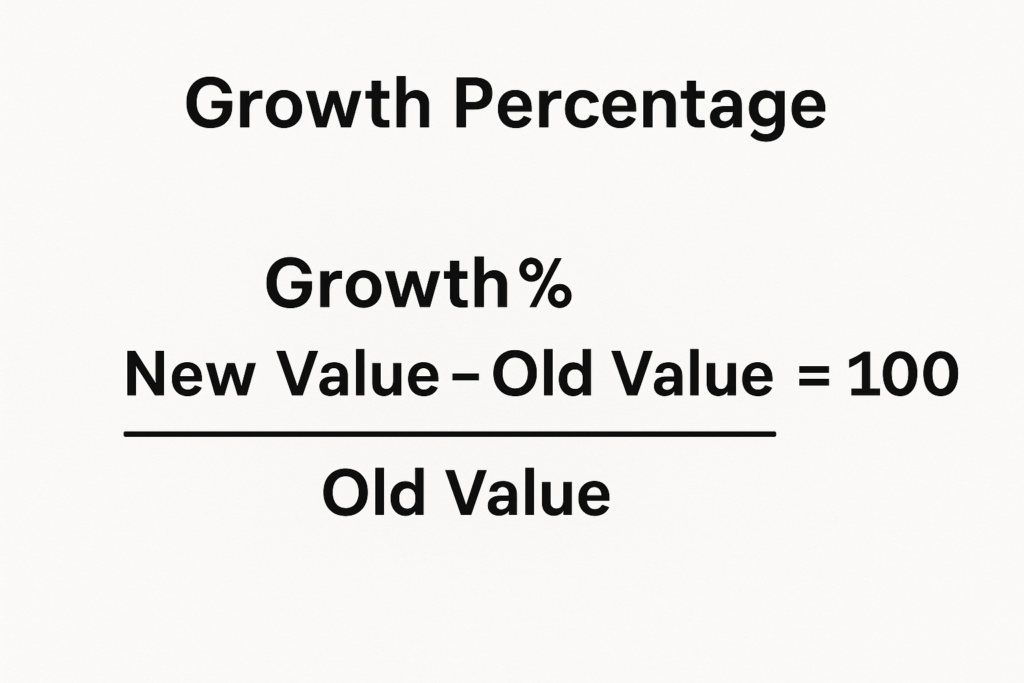
Growth percentage shows how much a value goes up or down over time. It’s expressed as a percentage. It shows how much progress or decline has occurred between a starting value and an ending value.
In simple terms:
Growth % = ((New Value – Old Value) / Old Value) × 100
It’s a critical metric used in:
- Business revenue tracking
- Financial forecasting
- Performance evaluation
- Inventory growth
- Customer base expansion
- Digital marketing metrics (followers, traffic)
Growth percentage gives a quick look at trends, patterns, and performance. This makes it one of the most useful indicators in data-driven settings.
How to Calculate Growth Percentage in Excel
Excel offers various ways to calculate growth percentage. The method you choose depends on how your data is set up. Below are the most commonly used techniques:
Basic Growth Percentage Formula
The simplest way to calculate growth percentage in Excel:
Formula: =(New Value – Old Value) / Old Value
Then, format the cell as Percentage by going to Home > Number > %.
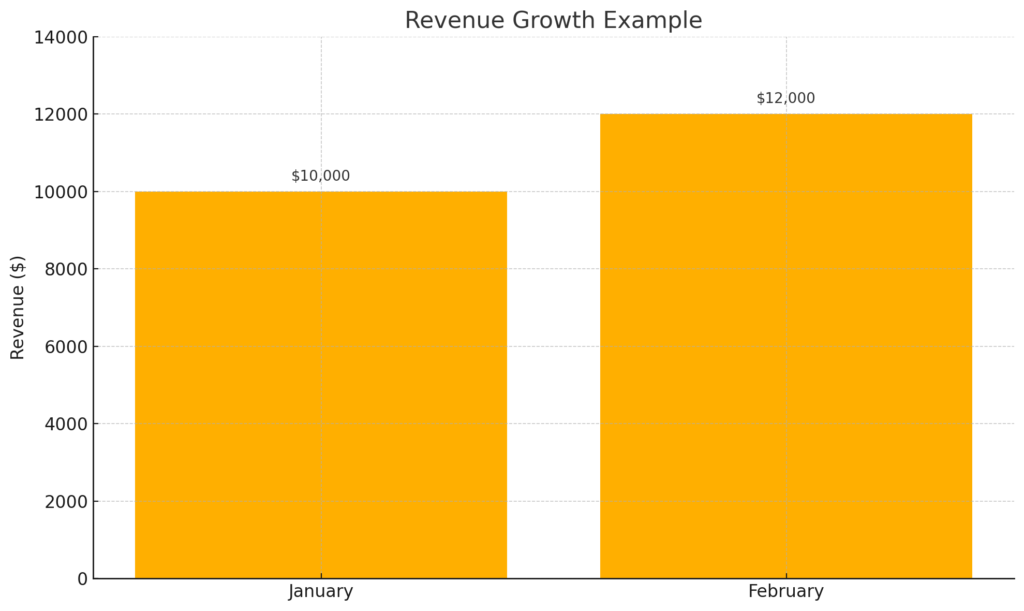
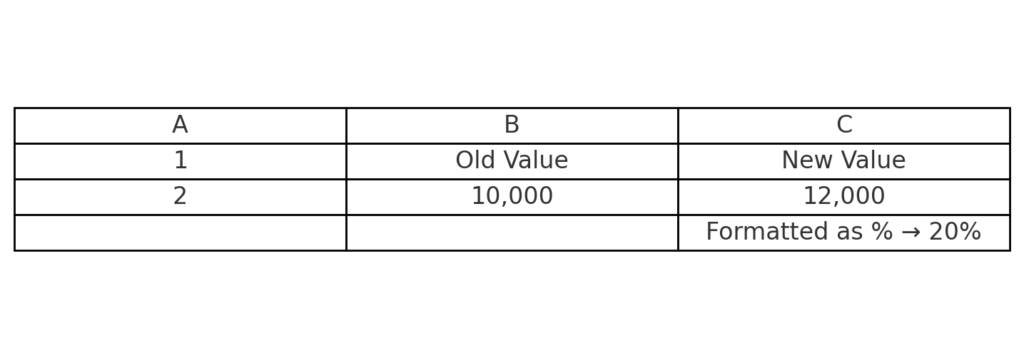
Example: Let’s say:
- Old value (January Revenue) is in cell A2 = 10,000
- New value (February Revenue) is in cell B2 = 12,000
Apply this formula in C2: =(B2-A2)/A2
This returns 0.2, which means 20% growth. After formatting as a percentage, it displays 20%.
Use Built-In Percentage Formatting
Instead of manually multiplying by 100, Excel can handle formatting:
- Just write: =(B2-A2)/A2
- Then go to Home > % Format
This avoids error-prone calculations and keeps formulas clean.
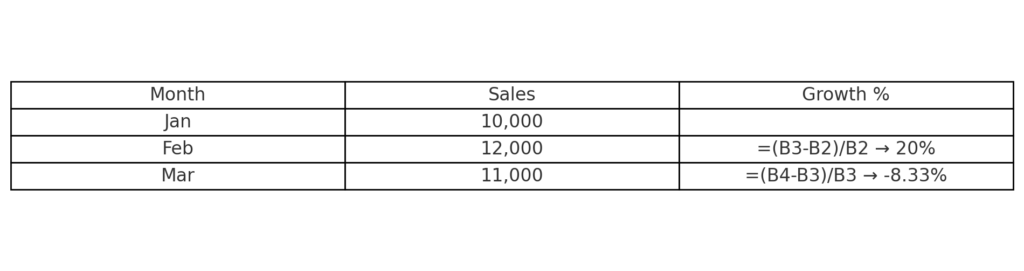
Applying to Multiple Rows
If you have a list of monthly or yearly data, you can drag the formula down:
| Month | Sales | Growth % |
| Jan | 10,000 | |
| Feb | 12,000 | =(B3-B2)/B2 → 20% |
| Mar | 11,000 | =(B4-B3)/B3 → -8.33% |
This method is great for dynamic reports and dashboards.
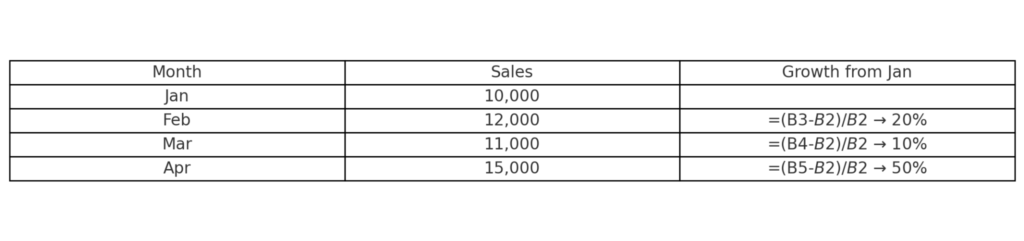
Absolute Reference for Baseline Growth
Use absolute cell reference if you compare all values to a fixed baseline, like the first month’s revenue.
Formula: =(B2-$B$2)/$B$2
This compares every month’s value to January’s sales.
Examples of Growth Percentage Calculation in Excel
Here are some real-life situations where the growth percentage in Excel is important:
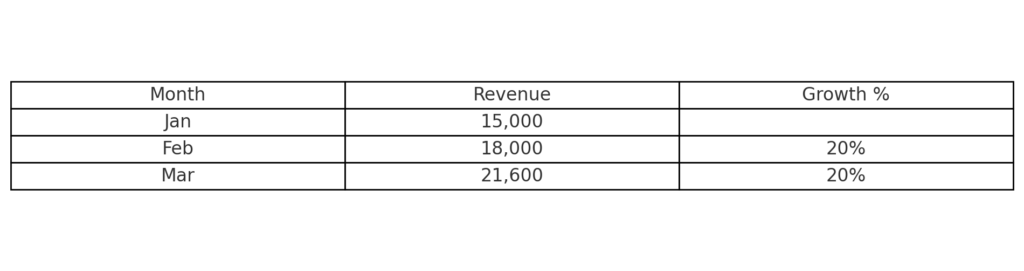
Example 1: Monthly Revenue Growth
| Month | Revenue | Growth % |
| Jan | 15,000 | |
| Feb | 18,000 | 20% |
| Mar | 21,600 | 20% |
Growth Column Formula: =(Current Month Revenue – Previous Month Revenue) / Previous Month Revenue.
This shows consistent 20% growth.
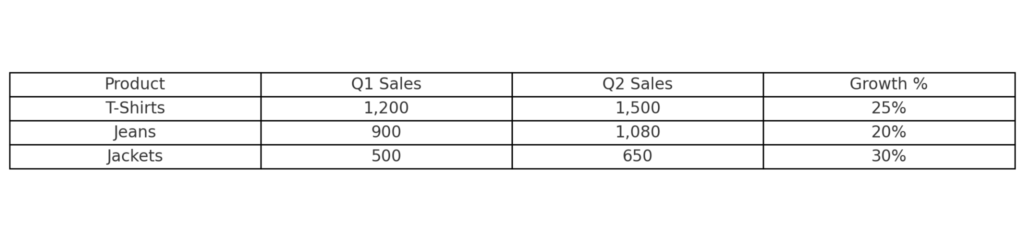
Example 2: E-commerce Product Sales
| Product | Q1 Sales | Q2 Sales | Growth % |
| T-Shirts | 1,200 | 1,500 | 25% |
| Jeans | 900 | 1,080 | 20% |
| Jackets | 500 | 650 | 30% |
Formula in Growth %: =(Q2-Q1)/Q1
Great for comparing seasonal performance.
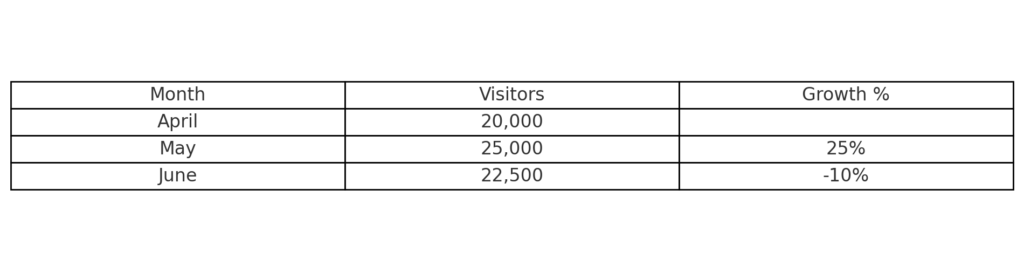
Example 3: Website Traffic Growth
| Month | Visitors | Growth % |
| April | 20,000 | |
| May | 25,000 | 25% |
| June | 22,500 | -10% |
Negative growth is also reflected, showing a decline.
Benefits of Calculating Growth Percentage in Excel
Helps Track Progress Over Time
Growth percentage enables individuals and businesses to track how well they’re doing. Excel clearly shows your progress in sales, customer base, or productivity. You can check trends weekly, monthly, quarterly, or yearly. You don’t need any third-party tools.
Simplifies Financial and Business Analysis
When making investment decisions or budgeting, knowing exact growth trends is essential. Excel offers a reliable way to calculate percentage changes and make informed decisions with historical data. This eliminates the guesswork and gives decision-makers clear insight.
Makes Data Visualization Easier
Excel has built-in charts and conditional formatting. You can use these tools to show growth percentages visually, like this:
- Bar charts
- Line graphs
- Color-coded cells (green for growth, red for decline)
This helps stakeholders quickly understand performance.
Supports KPI Dashboards and Reporting
Growth percentage is often a part of Key Performance Indicators (KPIs). Excel lets you add formulas to real-time dashboards. This helps you monitor performance metrics continuously. This supports better accountability and transparency.
Boosts Productivity for Data Professionals
Whether you’re a data analyst, marketing specialist, or small business owner, a ready-made Excel formula can save you hours of work. It’s scalable, efficient, and minimizes errors in large datasets. You can automate these calculations for larger workflows using macros or Google Sheets integrations.
FAQ’s
How can I calculate negative growth percentage in Excel?
Use the same formula =(New – Old)/Old. If the result is negative, Excel will show a negative percentage, indicating a decline.
Can I format growth percentage with color codes?
Yes, use Conditional Formatting in Excel to apply color scales. For example, green for positive growth, red for negative growth.
What if my old value is zero?
If the old value is zero, the formula will return a #DIV/0! error. You can handle this with: =IF(A1=0,””, (B1-A1)/A1) This avoids dividing by zero and keeps your spreadsheet clean.
Is there a way to show growth percentage with arrows?
Yes, use Icon Sets in Conditional Formatting. Excel uses green arrows for high values, yellow arrows for middle values, and red arrows for low values.
Conclusion
Knowing how to calculate growth percentage in Excel is a vital skill in today’s data-driven world. Excel helps you analyze finances, performance metrics, or user data. It offers a simple, powerful way to see and measure change. You can turn raw numbers into useful insights. Just use a simple formula and some formatting tricks.