
Excel is not just a spreadsheet. It’s a strong analytical tool for students, analysts, and business professionals. One of its most underused but powerful features is the Data Analysis Toolpak. To do complex tasks like regression, descriptive statistics, t-tests, or ANOVA, add data analysis tools to Excel. This will change how you manage your data. This guide will cover how to add data analysis in Excel. You’ll learn what data analysis is, see practical examples, and discover key benefits. We’ll also answer common questions and share tips to make the most of this feature.
What Is Data Analysis?
Data analysis is the process of collecting, organizing, interpreting, and visualizing data to extract useful insights and support decision-making. In Excel, this typically includes:
- Descriptive Statistics (mean, median, standard deviation)
- Regression Analysis
- t-Tests
- ANOVA (Analysis of Variance)
- Correlation
- Histogram creation
- Moving averages
- Sampling
Excel simplifies these processes through a built-in add-in called the Data Analysis Toolpak, which enables users to run advanced statistical operations with just a few clicks.

How to Add Data Analysis in Excel
The Data Analysis Toolpak is not always enabled by default, but it’s easy to add it in just a few steps.
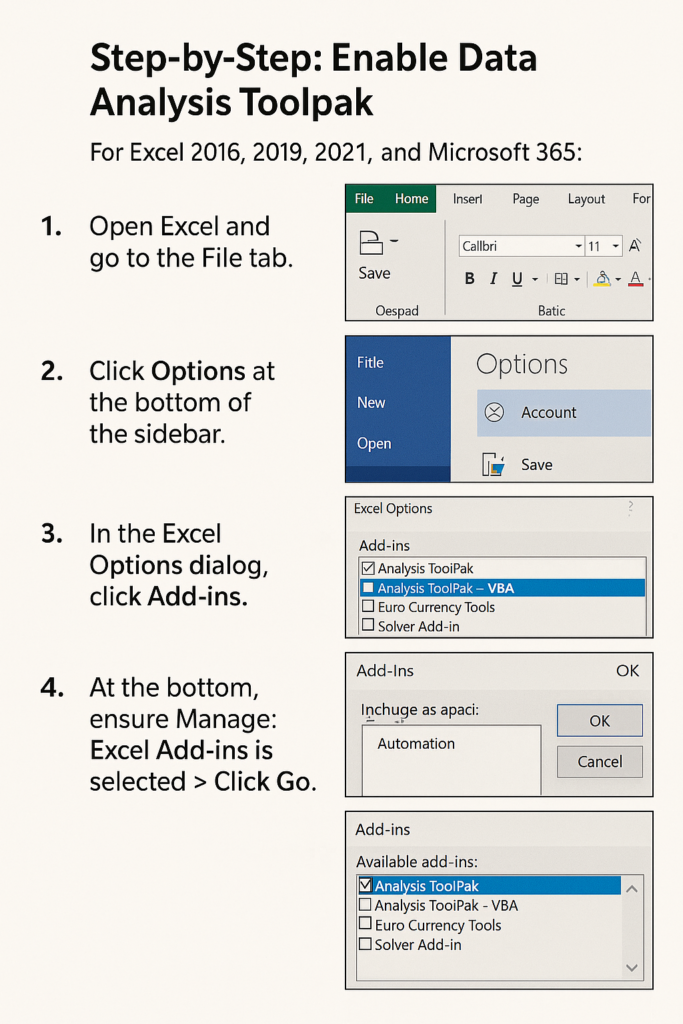
Step-by-Step: Enable Data Analysis Toolpak
For Excel 2016, 2019, 2021, and Microsoft 365:
- Open Excel and go to the File tab.
- Click Options at the bottom of the sidebar.
- In the Excel Options dialog, click Add-ins.
- At the bottom, ensure Manage: Excel Add-ins is selected > Click Go.
- In the Add-Ins box, check the box for Analysis ToolPak.
- Click OK.
Once enabled, you’ll see “Data Analysis” in the Data tab of the Excel Ribbon.
Quick Access Tip:
You can use Alt + A + T to open the Data Analysis dialog box once the tool is activated.
Examples of Using Data Analysis in Excel
Here are practical examples of what you can do with the Toolpak once it’s enabled:
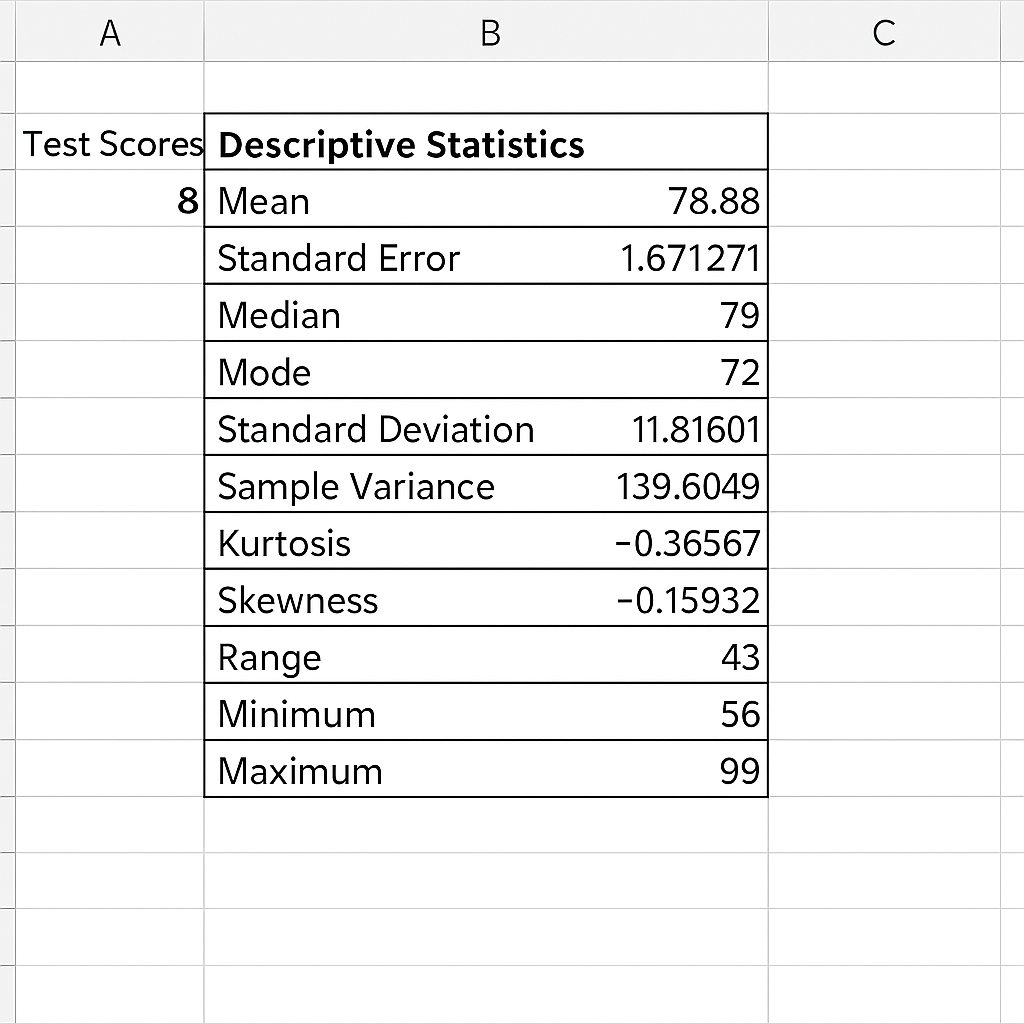
Example 1: Run Descriptive Statistics
You want to summarize test scores of 50 students:
- Go to Data > Data Analysis > Descriptive Statistics.
- Select your data range, check “Labels in First Row” and “Summary Statistics.”
- Excel will generate a table with mean, standard deviation, min, max, etc.
Example 2: Perform Regression Analysis
You’re studying the relationship between advertising budget and sales:
- Go to Data Analysis > Regression.
- Set Y Range (dependent variable) and X Range (independent variable).
- Enable outputs like R-squared and coefficients to understand impact.
Example 3: Conduct a t-Test
Compare results from two different groups (e.g., A/B test):
- Choose t-Test: Two Sample Assuming Equal Variances.
- Enter the two data ranges and interpret the p-value.
- If p < 0.05, the difference is statistically significant.
Benefits of Adding Data Analysis in Excel
Enables Advanced Statistical Analysis Without Coding
You don’t need to learn R, Python, or SPSS to run regressions or t-tests. Excel’s Toolpak brings advanced analytics to your fingertips. Business analysts can calculate ROI relationships using regression, all within Excel.
Saves Time and Improves Workflow Efficiency
Manual statistical calculations are time-consuming. The Data Analysis Toolpak automates them, letting you analyze more data in less time. In under 2 minutes, you can generate descriptive statistics for a 1000-row dataset.
Supports Better Decision-Making
From financial modeling to academic research, reliable data analysis drives informed decisions. Marketers use t-tests to validate whether changes in campaigns actually increase conversion rates.
Ideal for Students and Educators
Many academic assignments require statistical testing. Excel’s Toolpak is free and accessible, making it ideal for learning environments. Students can compare datasets easily. They can run correlation tests and export results for their research papers.
Creates Visual Outputs with Summary Reports
Functions like Histogram, Moving Average, and Regression automatically create tables and charts. This is great for dashboards or presentations. Charts generated are editable and can be customized to match your report style or branding.
No Internet or External Software Required
Excel works locally, unlike web tools or expensive software. It’s also common in schools and offices. Perfect for remote work or areas with limited internet access.
Frequently Asked Questions (FAQ’s)
Why don’t I see the Data Analysis option in Excel?
It’s not enabled by default. You need to go to File > Options > Add-Ins > Manage Excel Add-ins > Go > Check Analysis ToolPak > OK.
Is the Data Analysis Toolpak available in Excel Online?
No. As of 2025, Excel Online does not support the Data Analysis Toolpak. Use the desktop version instead.
Can I use the Toolpak on Mac?
Yes, but only with recent versions of Excel for Mac (Excel 2016 or later). Go to Tools > Excel Add-ins > Check Analysis ToolPak.
What’s the difference between Analysis Toolpak and Power Query?
- Toolpak is for statistical functions (regression, t-test).
- Power Query is for data transformation (merging, reshaping, filtering).
You can use both together for powerful reporting.
Can I use VBA with the Data Analysis Toolpak?
Yes, but it requires calling Excel’s analysis functions via macros. It’s more complex but allows automation of recurring statistical tasks.
Conclusion
Adding the Data Analysis Toolpak in Excel transforms how you work with data. This includes students, researchers, analysts, and business professionals. Just a few clicks unlock advanced tools. These tools help you understand trends, patterns, and relationships in your data better. Excel lets you do powerful analytics easily. You can run regressions, perform t-tests, and create histograms—all without coding knowledge.