

Excel is a top tool for managing and analyzing data. But it’s not just about formulas or functions—how you present the data is important too. Gridlines are an easy yet important feature. They help keep your spreadsheet organized and clear. They make reading, editing, and printing data much easier, especially in large datasets. In this guide, you’ll learn about gridlines. You’ll see how to add or customize them in Excel. We’ll share real-world examples and the benefits of using gridlines. Plus, we’ll answer common questions.
What Are Gridlines?
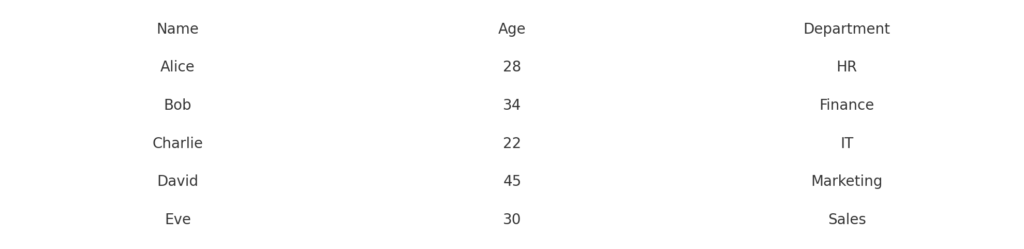
Gridlines in Excel are the faint gray lines that define the boundaries of cells in a worksheet. They act as visual guides, making it easier to view and align data properly in rows and columns.
Key Points:
- Gridlines do not print by default.
- They differ from cell borders, which are manually applied and visible in print.
- Gridlines appear automatically in a blank worksheet. You can hide, customize, or remove them as needed.
Gridlines are especially useful when working with:
- Financial statements
- Project planning sheets
- Invoicing templates
- Attendance or payroll registers
- Any structured data
How to Add Gridlines in Excel
Your method for adding gridlines in Excel can change based on your goal. If you want to view them on-screen or print, choose accordingly. Below are step-by-step instructions for both.
Method 1: Show Gridlines on Screen (Default Setting)
If gridlines are missing from your worksheet, you can turn them back on easily.
Steps:
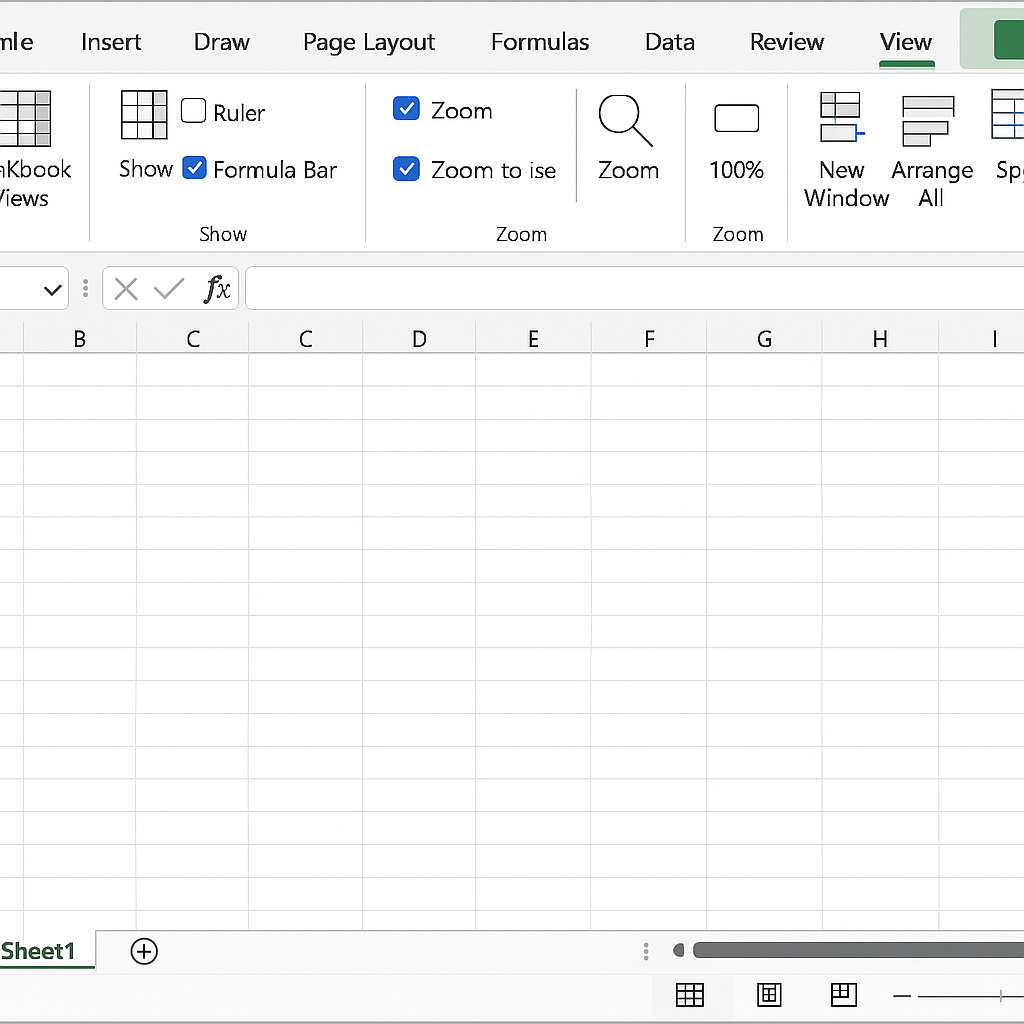
- Go to the View tab in the Excel ribbon.
- In the Show group, check the box labeled Gridlines.
This will restore the default gray gridlines on your screen.
Method 2: Add Gridlines for Printing
Gridlines are not printed by default. To print them:
Steps:
- Go to the Page Layout tab.
- In the Sheet Options group, check the box for Print under Gridlines.
- Go to File > Print Preview to confirm they appear.
- Print your worksheet with visible gridlines.
This is important for sharing hard copies. Otherwise, the printout will appear as blank white cells.
Method 3: Add Borders as Custom Gridlines (Print-Friendly Alternative)
For thicker or colored lines, use borders instead of gridlines. This is especially helpful for printing.
Steps:
- Select the range of cells.
- Go to the Home tab.
- In the Font group, click the Borders icon.
- Choose All Borders or a custom option.
- To customize: Click More Borders at the bottom of the menu. Choose line style, thickness, and color.
Unlike gridlines, borders will always print, and you can apply them in any style.
Method 4: Change Gridline Color
Excel lets you change the default gray gridline color for better visibility.
Steps:
- Go to File > Options > Advanced.
- Scroll down to the Display options for this worksheet section.
- Click the Gridline color dropdown and select your preferred color.
- Click OK.
This change will only apply to the active worksheet.
Examples
Example 1: Budget Sheet with Printable Gridlines
You’re creating a monthly expense report to share with your manager. Enable Print Gridlines to make the printed version readable. This keeps the numbers organized without needing to add borders manually.
Example 2: Project Tracker with Custom Borders
In a project planning sheet, you want to highlight certain sections. You hide the default gridlines and use blue borders around task cells for a cleaner, branded look.
Example 3: Employee Attendance Register
To read rows and columns better, restore missing gridlines using the View tab. This helps your team align entries correctly as they work on the sheet.
Benefits of Using Gridlines in Excel
Enhances Readability and Navigation
Gridlines help separate rows and columns. This makes it easier to follow data from left to right and top to bottom. This helps users avoid misreading values or entering data in the wrong cells.
Especially helpful in:
- Long tables with similar numbers
- Datasets with small fonts
- Daily trackers and inventory sheets
Supports Better Data Entry Accuracy
Without gridlines, it’s easy to accidentally enter information into the wrong cell. Gridlines guide your eyes and mouse, ensuring more accurate data input.
This is crucial for:
- Payroll records
- Timetables
- Stock entry forms
Improves Printed Reports
When gridlines are enabled for printing, they make your documents look more organized. This helps with financial reports, student sheets, or any paper documents. It avoids the need to apply borders manually and maintains uniform spacing.
Offers Flexibility for Custom Design
You can hide the default gridlines. Also, you can add custom borders for a unique, branded look to your spreadsheet. This is ideal for reports, dashboards, and client-facing documents where aesthetics matter.
Excel allows you to:
- Change gridline color
- Hide gridlines for clean visuals
- Apply borders selectively
Helps in Data Alignment and Formatting
Gridlines assist in aligning text, numbers, charts, and images precisely. If you’re building a form or dashboard, they act as invisible rulers.
They’re useful during:
- Cell merging
- Inserting shapes or images
- Creating structured layouts
Essential for Collaborative Work
In team projects or shared files, gridlines help users navigate the spreadsheet easily. Everyone can follow the structure more easily, reducing mistakes and improving productivity.
This is especially important in:
- Shared financial templates
- Departmental spreadsheets
- School or office admin workbooks
Show Gridlines in Excel (Works Every Time)
FAQ’s
Do gridlines print automatically?
No. To print them, you need to enable this manually. Go to Page Layout, then Sheet Options, and finally Print (under Gridlines).
How do I make gridlines darker or colored?
Go to File > Options > Advanced, scroll to Gridline color, and select a darker or more visible shade.
What’s the difference between gridlines and borders?
Gridlines are the faint background lines visible on screen. Borders are custom cell edges. You can change their thickness, color, and style. They always show up in print.
Can I remove gridlines from a specific section?
You can hide gridlines for the whole sheet in the View tab. Or, you can make them disappear by filling selected cells with white. For localized formatting, use borders instead.
Conclusion
Gridlines in Excel seem simple, but they really help with usability and readability. They also improve the visual structure of your spreadsheet. Gridlines make it easier to manage data, prepare reports, and share files. They help keep layouts clean, organized, and simple to follow. Excel lets you control how your spreadsheet looks and works. You can turn on gridlines for printing. You can also change their color or swap them for borders.