
In data analysis, the margin of error is key. It shows how much uncertainty exists in statistical results. When you conduct a survey, check business data, or look at test results, the margin of error (MOE) indicates whether your conclusions are trustworthy. Microsoft Excel provides an easy and effective way to calculate the margin of error. You don’t need complicated statistical software. Whether you’re conducting surveys, running experiments, or presenting results, calculating the margin of error helps ensure your findings are statistically valid and trustworthy.
What is a Margin of Error?
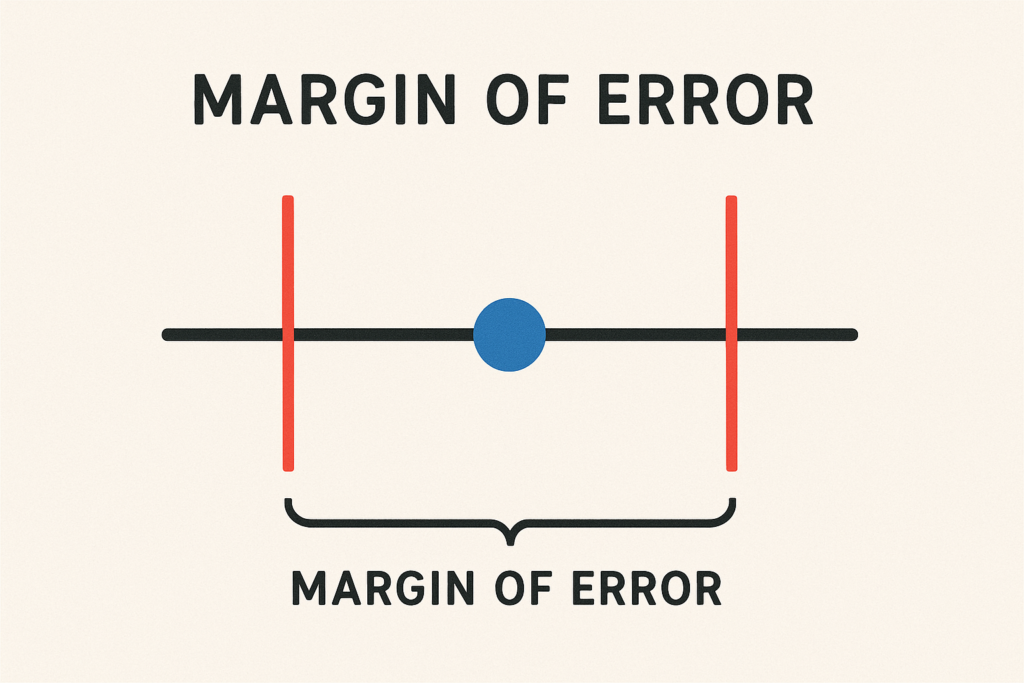
The margin of error shows the range where the true population parameter is likely to be. It considers sampling variability. It’s often linked to confidence levels, such as 90%, 95%, or 99%.
Key Characteristics:
- Tied to Confidence Intervals: The higher the confidence level, the larger the margin of error.
- Depends on Sample Size: A larger sample size leads to a smaller margin of error.
- Measures Uncertainty: MOE helps assess how much trust you can put in your survey or sample data.
For example, if a poll shows 55% support for a candidate with a ±3% margin of error, actual support may be between 52% and 58%.
How to Calculate a Margin of Error in Excel?
Formula Used in Excel:
Margin of Error = Z × (σ / √n) Where:
- Z = Z-score (based on the desired confidence level)
- σ = Standard deviation of the sample
- n = Sample size
Step-by-Step Guide:
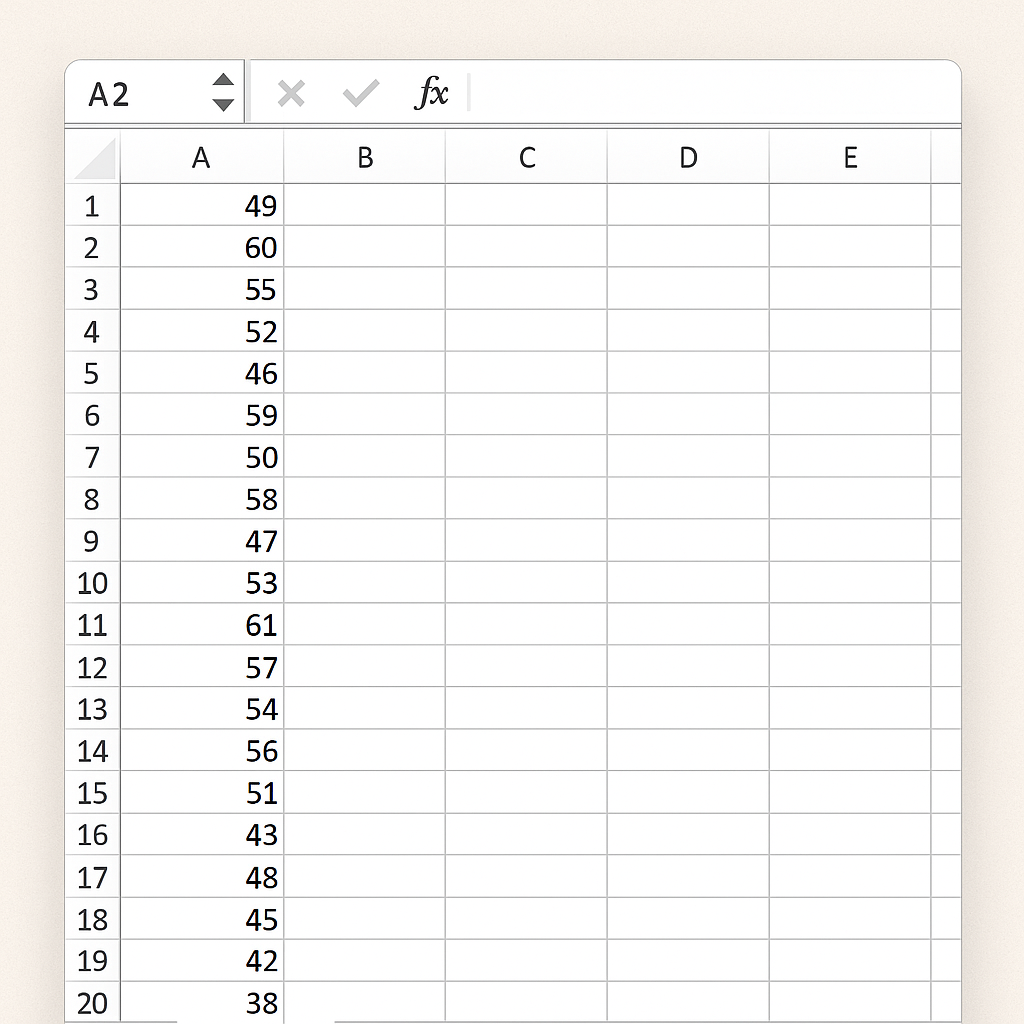
Step 1:
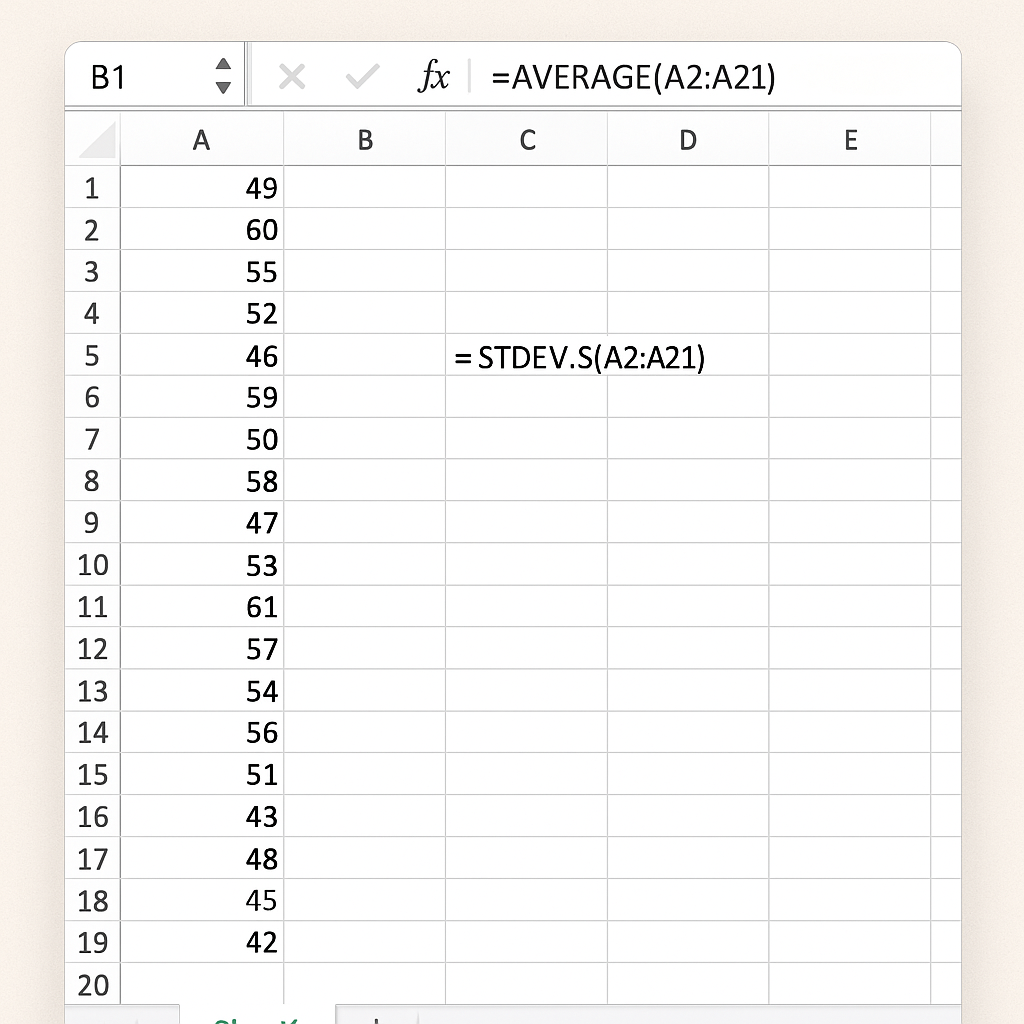
Open Excel and input your data points in a column (say A2:A21).
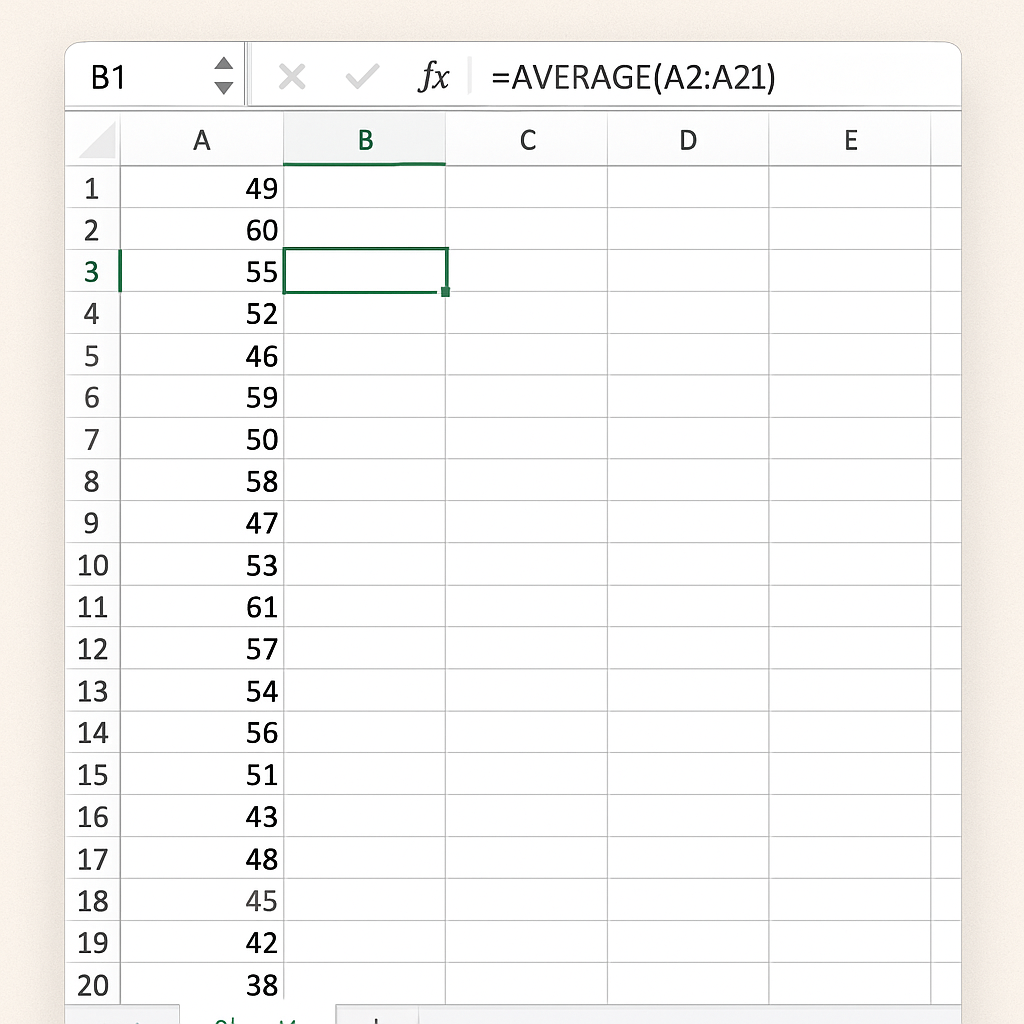
Step 2:
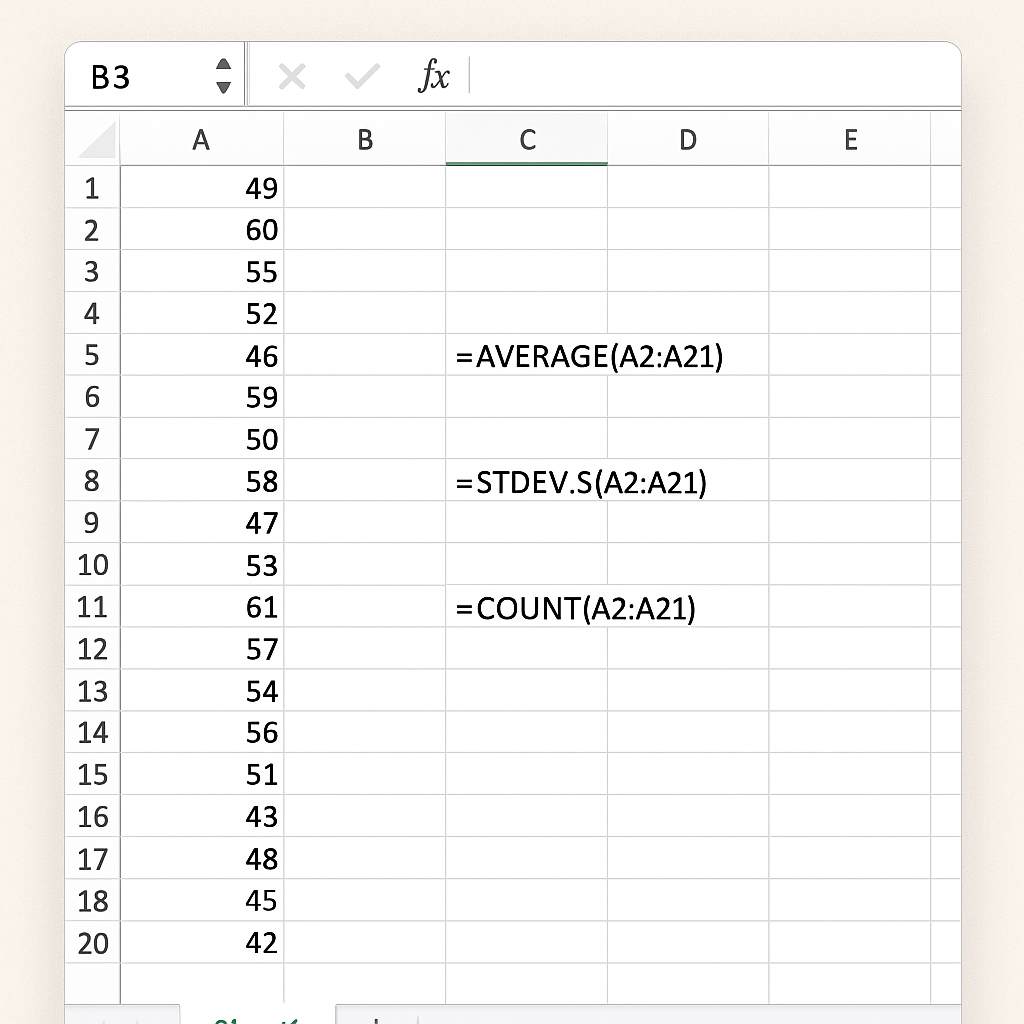
Calculate the Sample Mean: =AVERAGE(A2:A21)
Step 3:
Calculate Standard Deviation (σ): Use =STDEV.S(A2:A21)
Step 4:
Calculate Sample Size (n): =COUNT(A2:A21)
Step 5:
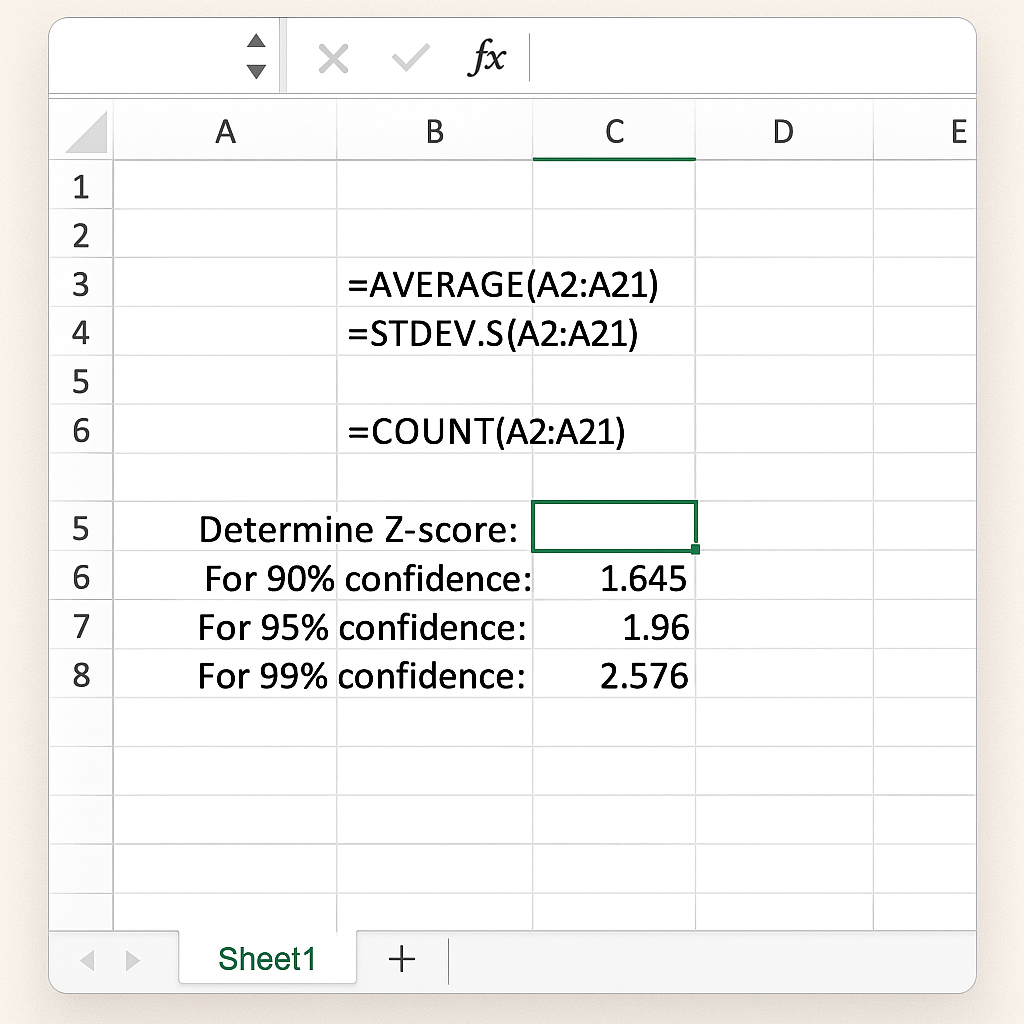
Determine Z-score:
For 90% confidence: 1.645
For 95% confidence: 1.96
For 99% confidence: 2.576 (You can manually enter or use statistical tables)
Step 6:
Apply the Formula: =Z (Standard_Deviation / SQRT(Sample_Size)) Example in Excel: =1.96 (STDEV.S(A2:A21) / SQRT(COUNT(A2:A21)))
Examples of Margin of Error in Excel
Example 1: Customer Satisfaction Survey
You surveyed 30 customers about product satisfaction. Their scores (1–10) are entered in cells B2:B31. You want to calculate the 95% margin of error:
=1.96 * (STDEV.S(B2:B31) / SQRT(COUNT(B2:B31)))
This returns a value (e.g., ±0.8), meaning your average satisfaction score has a ±0.8 margin at 95% confidence.
Example 2: Test Scores for a Class
If 20 students scored between 60 and 95 on a test, and you want to analyze the reliability of the average score:
=2.576 * (STDEV.S(C2:C21) / SQRT(COUNT(C2:C21)))
This gives you a 99% margin of error—great for high-stakes evaluations.
Benefits of Calculating Margin of Error in Excel
Improves Decision-Making Accuracy
By calculating the MOE, decision-makers can avoid overgeneralizing results from small samples. This is crucial in areas like finance, product testing, or marketing analytics.
Example: If you see a 70% satisfaction rate, remember the margin of error is ±5%. This means actual satisfaction might be as low as 65%.
Reduces the Risk of Misinterpretation
Without MOE, data can be misleading. Excel makes it easy to add this context so results are interpreted correctly.
Example: In product feedback surveys, users might prefer one prototype over another by 3%. But if the MOE is ±4%, the difference is statistically insignificant.
Cost-Effective and Accessible
You don’t need fancy tools. Excel is already in most workplaces and schools. It’s especially helpful for small businesses and students.
Real-Time Calculation and Adjustment
You can change the dataset anytime. Excel will then recalculate the MOE automatically. This saves time in processes like A/B testing.
Highly Customizable and Visual
You can use margin of error calculations with Excel charts. This helps create confidence interval plots, which are great for reports and presentations.
Calculating the margin of error in Excel
FAQ’s About Margin of Error in Excel
What if I don’t know the population standard deviation?
Use sample standard deviation STDEV.S() as an estimate. For large enough sample sizes (n ≥ 30), this is statistically acceptable.
How do I choose the right Z-score?
It depends on your desired confidence level:
- 90% → 1.645
- 95% → 1.96
- 99% → 2.576
What if my data is skewed?
If your sample is skewed or small (n < 30), consider using t-distribution instead of Z-scores. Use Excel’s T.INV.2T() function for this.
Can I calculate MOE for proportions in Excel?
Yes. For binary outcomes (e.g., yes/no), use this formula:
=Z SQRT((p(1-p))/n)
Where p is the sample proportion (e.g., 0.6).
Conclusion
Calculating the margin of error in Excel helps you make better decisions based on data. It makes things clear, adds trust to the stats, and helps you understand your results better. Excel turns into a strong tool for analyzing uncertainty with just a few formulas. It’s great for surveys, reports, and research that meet today’s data standards.