
")
Knowing your business’s financial health is key. Break-even analysis is a great tool to check profitability. Finding your break-even point is key for new or current businesses. It shows how much you need to sell to cover your costs. This insight is key for making smart decisions. You can automate this process in Microsoft Excel. Use formulas, charts, and structured data inputs. In this guide, we’ll explain break-even analysis. You’ll learn how to calculate it in Excel. We’ll also cover its benefits, limitations, and answer important questions.
What is Break-Even Analysis?
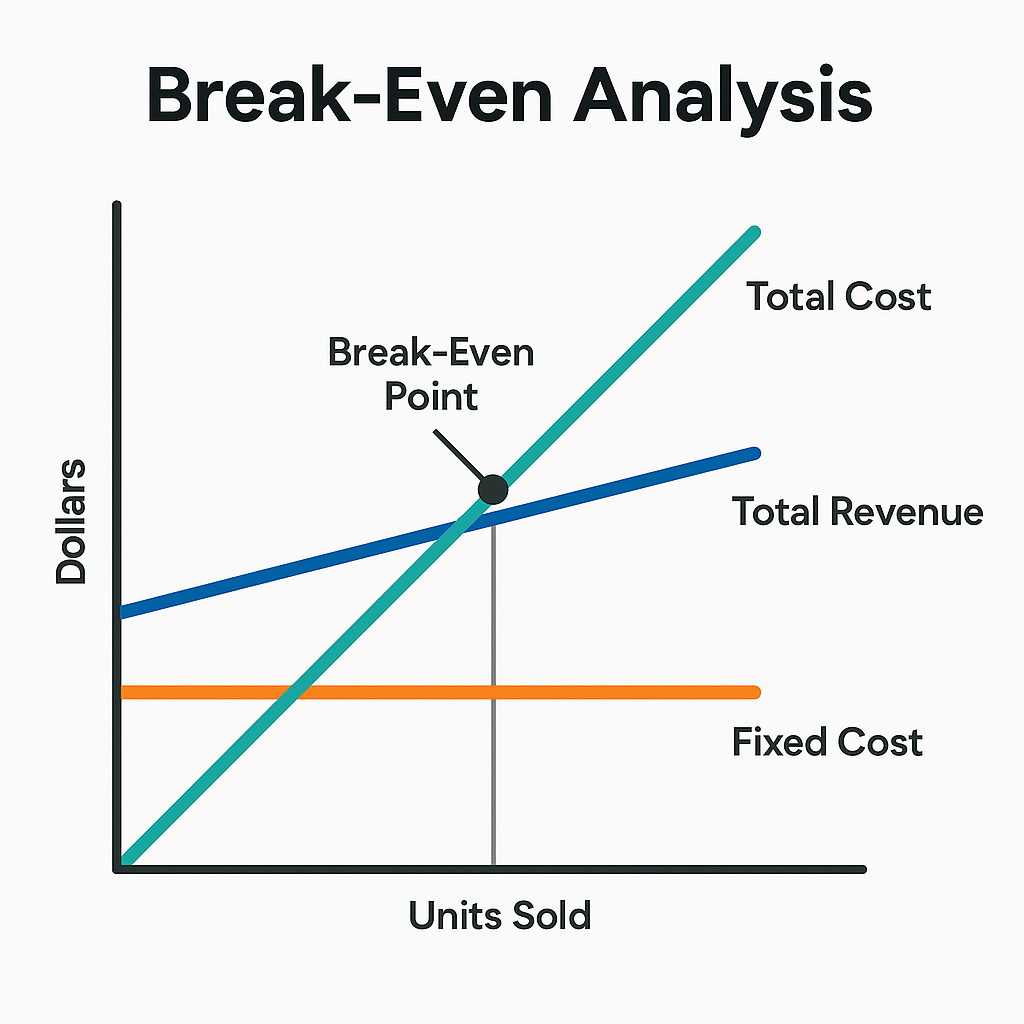
Break-even analysis finds the point where your business’s total revenues match total costs. At this point, you make neither profit nor loss. This point is known as the break-even point (BEP).
It’s calculated using the following formula:
Break-Even Point (in Units) = Fixed Costs / (Selling Price per Unit – Variable Cost per Unit)
This tool allows you to:
- Assess the viability of new ventures
- Forecast profits
- Optimize pricing strategies
- Understand cost structures and profitability margins
Break-even analysis helps with budgeting and pricing. It’s used in many industries, like retail, manufacturing, and services.
How to Calculate Break-Even Analysis in Excel?
Step 1: Open a New Worksheet
Begin by opening Microsoft Excel and creating a clean sheet to input your data.
Step 2: Define Your Variables
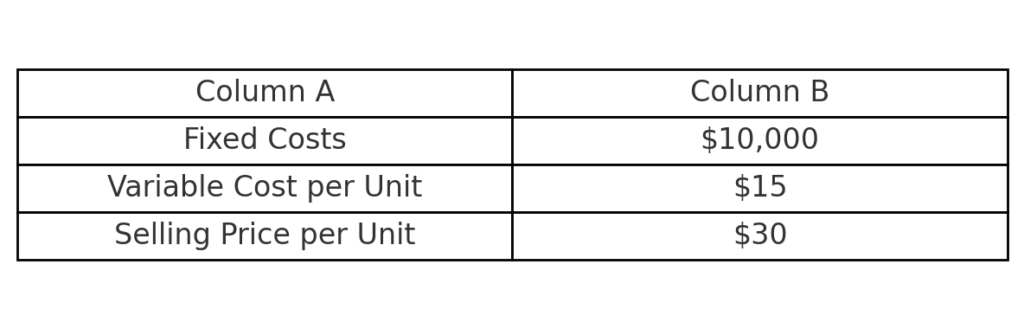
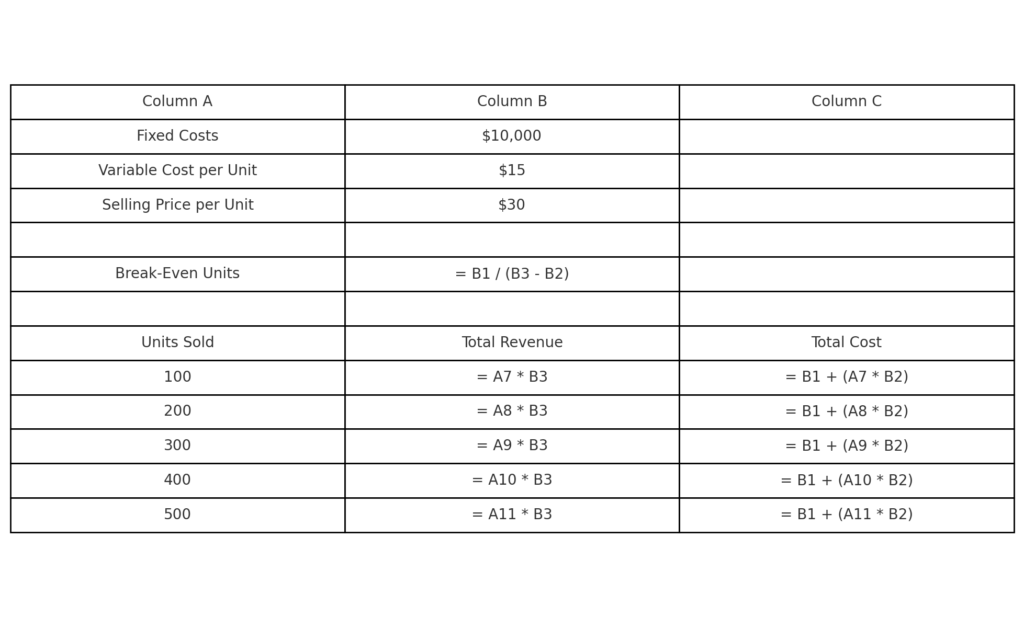
Label the following in Column A:
- Fixed Costs
- Variable Cost per Unit
- Selling Price per Unit
Then, enter your values in Column B next to each label:
- Fixed Costs: $10,000
- Variable Cost per Unit: $15
- Selling Price per Unit: $30
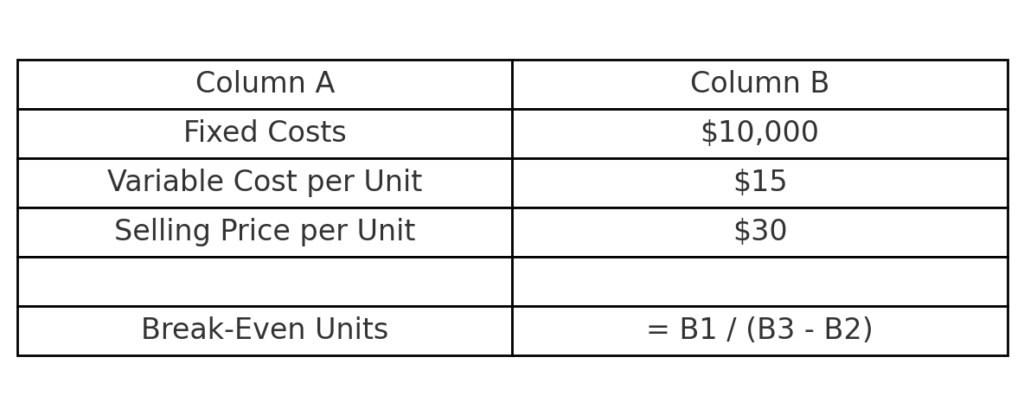
Step 3: Apply the Break-Even Formula
In cell A5, type: Break-Even Units
In cell B5, input the formula:
= B1 / (B3 – B2)
This calculates how many units you need to sell to break even.
Step 4: Add Total Revenue and Cost Formulas
For better analysis, calculate Total Revenue and Total Cost at different sales volumes.
In A7 to A12, label sales volumes like 100, 200, 300, 400, 500 units.
In B7, use:
= A7 * B3 (Total Revenue)
In C7:
= B1 + (A7 * B2) (Total Cost)
Drag the formulas down for all rows.
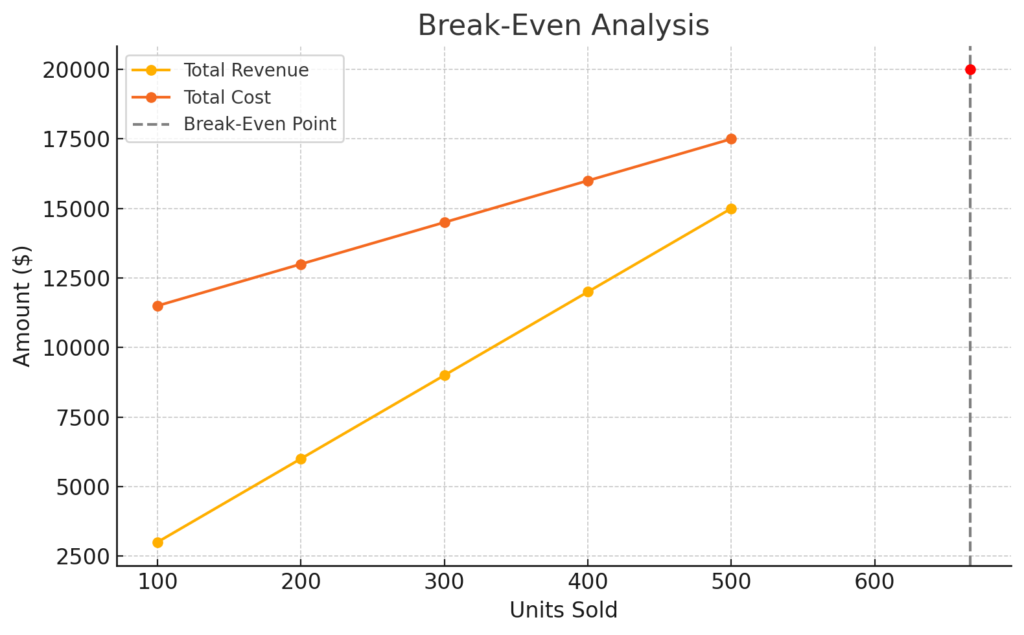
Step 5: Create a Break-Even Chart
Highlight the units, total revenue, and total cost columns. Then:
- Go to Insert > Line Chart
- Select Line with Markers
- Format the chart to show where revenue meets cost — your break-even point.
Benefits of Calculating Break-Even Analysis in Excel (In-Depth)
Data-Driven Decision Making
Automating break-even calculations in Excel helps businesses make key decisions. These include product launches, pricing models, and budget allocations, all based on precise data. It removes guesswork. This helps managers see how many units they must sell to prevent losses. For entrepreneurs, it validates if a business idea is financially viable before investing large sums.
Scenario Analysis and Flexibility
Excel enables you to simulate multiple what-if scenarios effortlessly. For example, you can:
- Change fixed or variable costs
- Test different pricing strategies
- Forecast profit margins under changing sales volumes
This flexibility shows how various factors affect profitability.
Visual Insights through Dynamic Charts
Excel’s charting tools help you see revenue and cost trends. This way, you can quickly find your break-even point. A break-even chart shows stakeholders when they can expect to make a profit. It clearly highlights risks and timelines.
Integration with Business Models
You can combine break-even analysis in Excel with other financial tools. These tools include profit margin analysis, cash flow forecasting, and ROI calculations. It is a key part of any financial model. It helps with complete business planning.
Cost-Effective and Scalable
Unlike paid software, Excel is a cost-effective tool readily available in most workplaces. As your business grows, your spreadsheets can change a lot. They can go from simple calculations to complex dashboards. You might add macros and data validation too. This scalability makes Excel an indispensable tool for both startups and large enterprises.
Limitations of Break-Even Analysis
While powerful, break-even analysis does come with limitations:
Assumes Linear Costs and Revenues
The model assumes costs and revenues rise with sales. This may not be realistic. For example, bulk purchase discounts or tiered pricing may skew linearity.
Ignores Market Dynamics
Break-even analysis does not account for competitor pricing, customer demand, or seasonal trends. You might reach your BEP, but if market demand is low, it won’t translate into real success.
Static Variable Estimates
It relies on fixed input values for costs and prices. In dynamic markets, prices and costs change often. This happens because of inflation, supplier rates, and currency shifts. So, static models become less reliable over time.
No Time Element
Break-even analysis doesn’t show how long it takes to reach the break-even point. This makes it less helpful for cash flow planning or predicting ROI.
Break Even Analysis using Excel
FAQ’s
What is the break-even point in Excel?
It’s the unit quantity at which total revenue equals total costs.
Can I use Excel to create a dynamic break-even chart?
Yes. With formulas and chart tools, you can visualize break-even points dynamically. Excel allows you to plot revenue and cost curves, making it easy to identify your BEP visually.
What is the difference between fixed and variable costs in Excel?
- Fixed Costs: These remain constant regardless of the number of units sold (e.g., rent, salaries).
- Variable Costs: These increase with each unit sold (e.g., raw materials, packaging).
Is break-even analysis only useful for products?
No. Break-even analysis is also useful for services, events, and subscription models. As long as you can estimate your fixed and variable costs against revenue, it applies.
Conclusion
Break-even analysis isn’t just a financial formula. It’s a key strategy that helps businesses connect their operations to profit. Using Excel simplifies the process, turning complex data into clear insights. Understanding your break-even point is very valuable. There are some limits to think about, especially in complex business models. Excel’s visual tools help entrepreneurs and managers make smarter, data-driven choices.