
Knowing when your business will turn a profit is key for planning and forecasting. This is where Break-Even Analysis comes into play. Excel is great for calculating and showing your break-even point. Whether you’re launching a product, running a service, or planning an investment, it works well for you. In this article, you’ll discover what break-even analysis is. You’ll also learn how to calculate it in Excel. We’ll provide practical examples and discuss the benefits. Plus, you’ll find answers to common questions and a conclusion—all designed for clarity and value.
What is Break-Even Analysis?
Break-even analysis shows when total revenues match total costs. At this point, there’s no profit or loss. It shows how many units must be sold or how much revenue is needed to cover all costs, both fixed and variable.
Key Components:
- Fixed Costs: Expenses that do not change with production volume (e.g., rent, salaries).
- Variable Costs: Costs that vary per unit produced (e.g., raw materials, packaging).
- Selling Price per Unit
- Break-Even Point (BEP): The number of units (or revenue amount) needed to cover all expenses.
Formula:
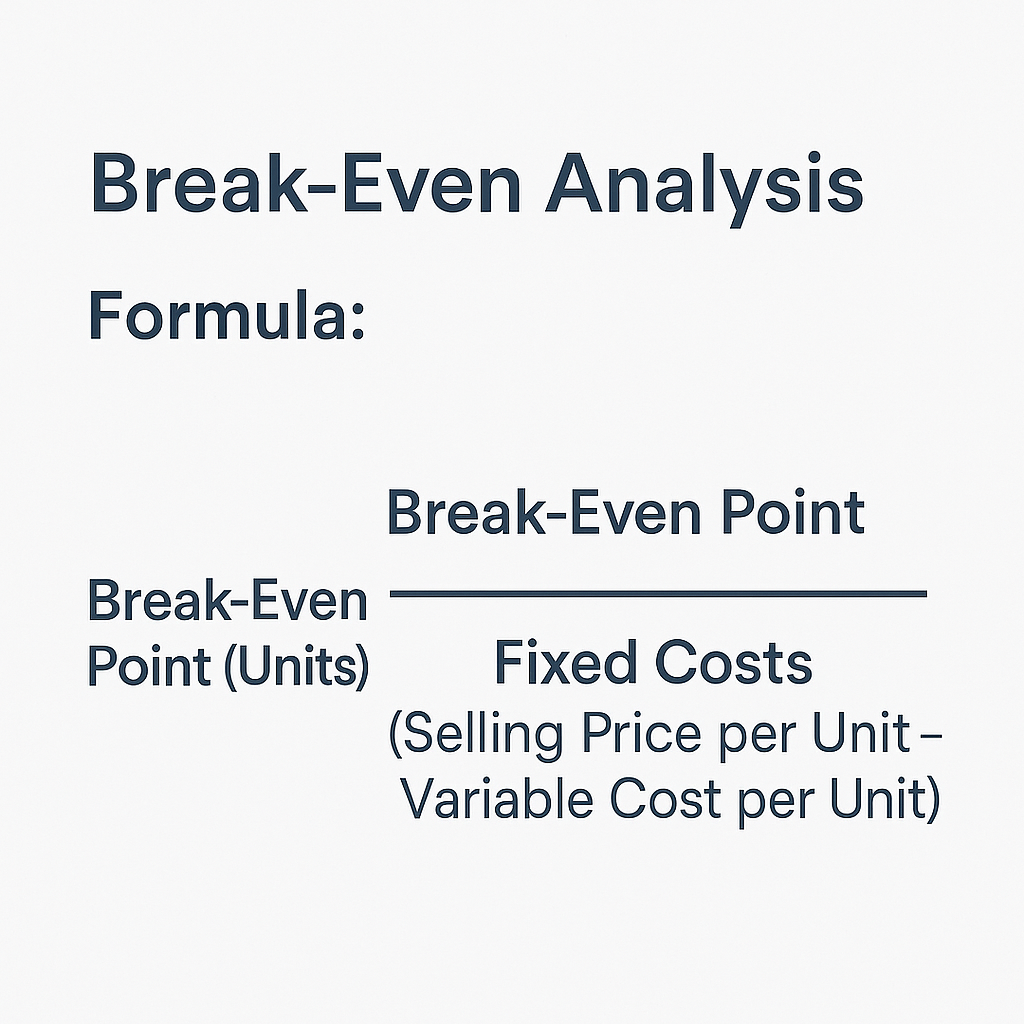
Break-Even Point (Units) = Fixed Costs / (Selling Price per Unit – Variable Cost per Unit)
How to Calculate Break-Even Analysis in Excel?
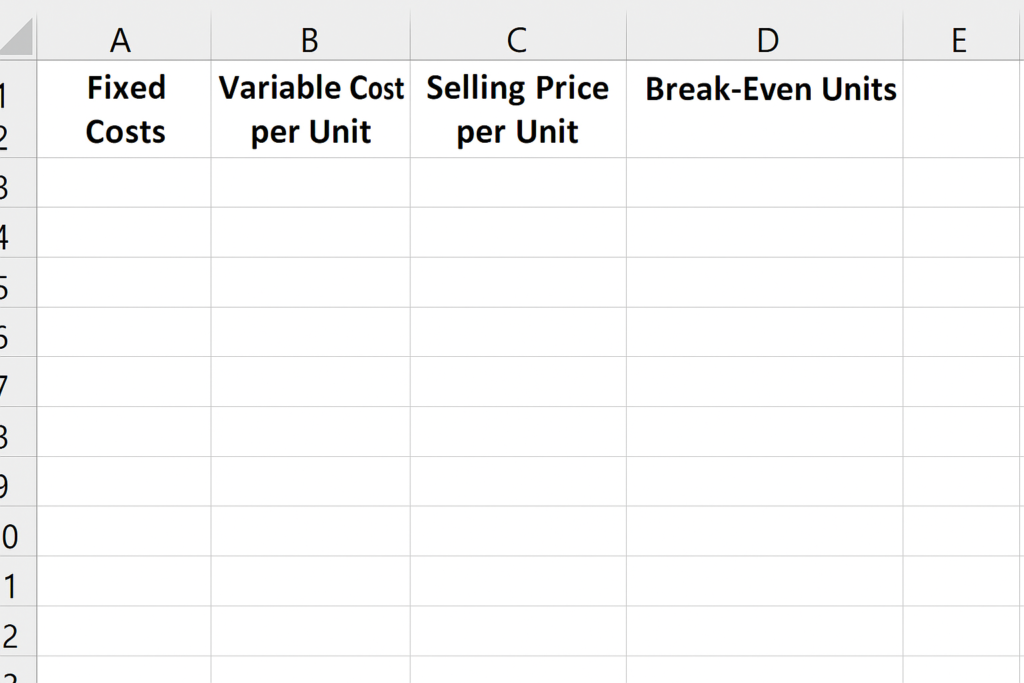
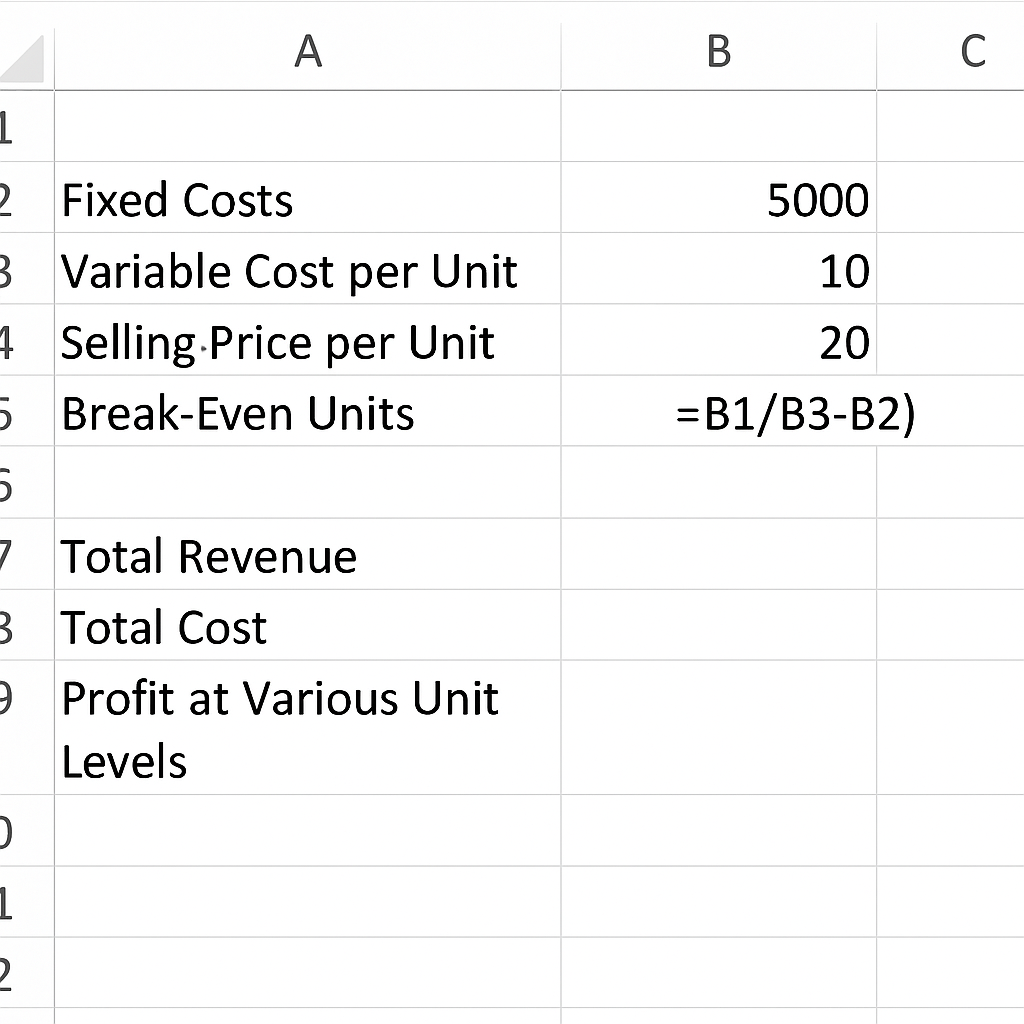
Step 1: Set Up Your Excel Spreadsheet
Create columns for:
- Fixed Costs
- Variable Cost per Unit
- Selling Price per Unit
- Break-Even Units
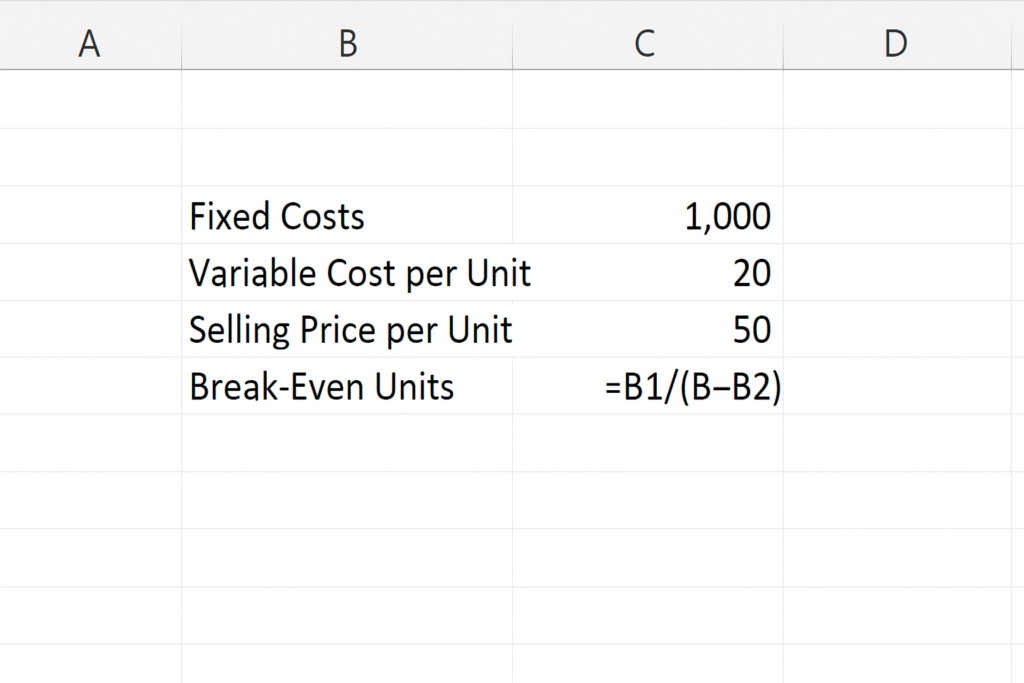
Step 2: Apply the Formula
In the Break-Even Units cell:
= B1 / (B3 – B2)
Where:
- B1 = Fixed Costs
- B2 = Variable Cost per Unit
- B3 = Selling Price per Unit
Step 3: Optional – Add Revenue & Cost Projections
Create additional rows for:
- Total Revenue
- Total Cost
- Profit at Various Unit Levels This can be used to build a Break-Even Chart using Excel’s Insert > Chart feature.
Examples of Break-Even Analysis in Excel
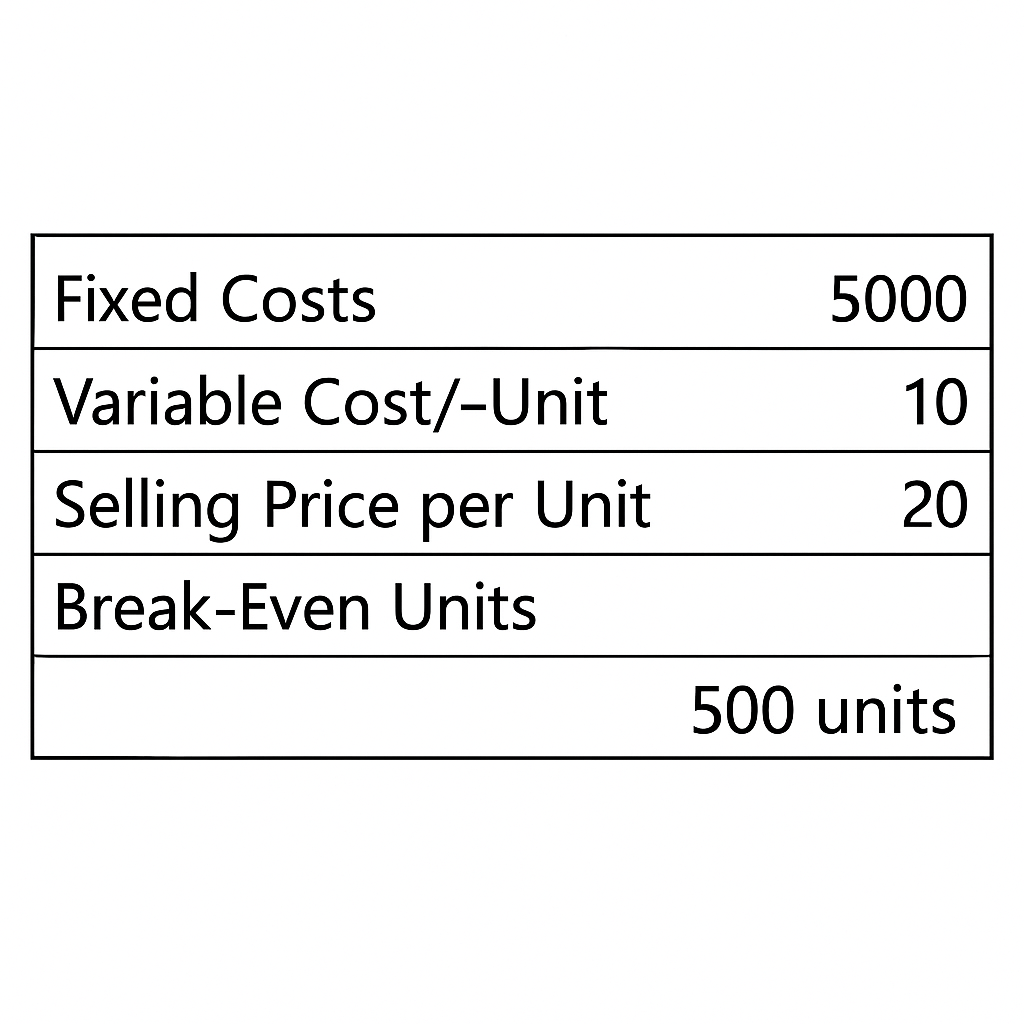
Example 1: Small Business
- Fixed Costs: $5,000
- Variable Cost/Unit: $10
- Selling Price/Unit: $20
- Break-Even = 5000 / (20 – 10) = 500 units
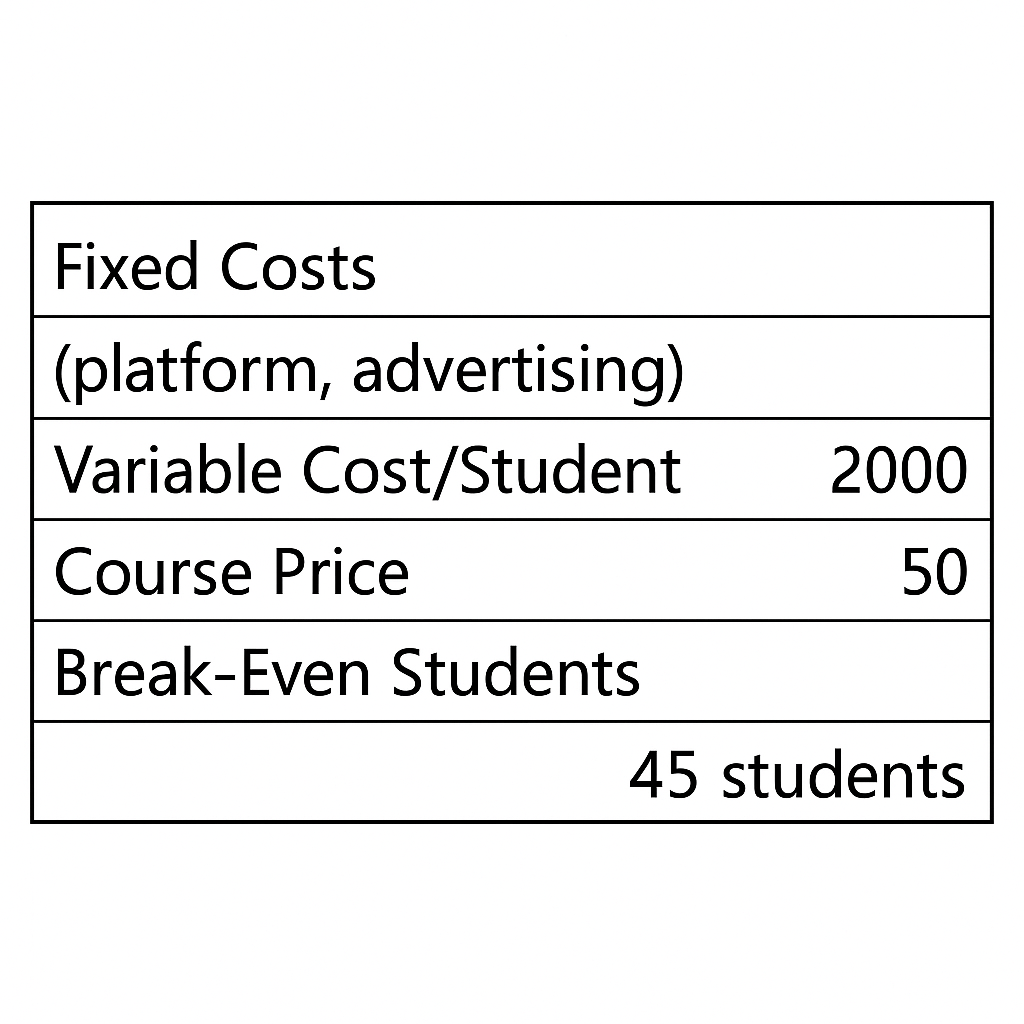
Example 2: Online Course
- Fixed Costs (platform, advertising): $2,000
- Variable Cost/Student: $5
- Course Price: $50
- Break-Even = 2000 / (50 – 5) = 44.44 ≈ 45 students
Example 3: SaaS Subscription Model
- Fixed Infrastructure: $8,000
- Variable Cost/User: $3
- Monthly Fee: $15
- Break-Even = 8000 / (15 – 3) = 666.67 ≈ 667 users
Excel makes it easy to adapt the formula based on different pricing, cost, and revenue models.
Benefits of Calculating Break-Even Analysis in Excel
Quick and Accurate Financial Insights
Excel provides real-time calculation updates when you change input values. You can test different pricing models, cost structures, or sales volumes instantly.
Why it matters: It speeds up decision-making. It also lowers the risk of underpricing or overcommitting resources.
Scenario Planning & Forecasting
Excel lets you run “what-if” scenarios. You can see how changes in cost or price impact profits.
Why it matters: It helps you prepare for market changes, competitor moves, or scaling up operations.
Visual Representation of Break-Even Point
Excel allows you to insert line charts to plot Total Revenue and Total Cost. The intersection indicates the break-even point.
Why it matters: Visuals make complex financial data simple. They help share insights with stakeholders, investors, and team members.
Customizable & Scalable
Excel works for any business model, like eCommerce, freelancing, product sales, or SaaS. You can customize layouts, automate with formulas, or link to other financial sheets.
Why it matters: Makes Excel a versatile tool for businesses of all sizes and types.
Low-Cost, High-Efficiency Tool
No need for expensive financial modeling software. Excel is in most business toolkits. It gives you valuable financial insights with little cost.
Why it matters: This is great for startups, freelancers, or small business owners with tight budgets.
Break Even Analysis using Excel
FAQ’s: Break-Even Analysis in Excel
Can Excel automatically calculate the break-even point?
Yes. Enter the right formula and use cell references. Then, Excel will recalculate the break-even point automatically whenever the data changes.
Is break-even analysis useful for service-based businesses?
Absolutely. Even if you’re not selling physical products, fixed and variable costs still exist. Break-even analysis helps in pricing services and managing costs.
Can I make a break-even chart in Excel?
Yes. Use Excel’s Insert > Line Chart to plot total revenue and total cost. The point where the two lines intersect is your break-even point.
What if my variable cost per unit is higher than the selling price?
Your break-even point will be negative, indicating you’re incurring a loss. You must either reduce costs or increase your price to achieve profitability.
Is break-even the same as profit?
No. Break-even means you’re covering all costs but not making a profit. Profit begins after you surpass the break-even volume.
Conclusion
Break-even analysis is key for smart business planning. Excel is a flexible tool that helps you calculate and visualize it effectively. Mastering break-even point calculations in Excel helps you understand your costs. This way, you can set better prices and lower financial risks.