

Knowing how to calculate CAGR (Compound Annual Growth Rate) in Excel is key for investors, analysts, business owners, and finance pros. CAGR helps you track investment growth, revenue trends, or business expansion. It shows the steady rate of return over a set time. This guide covers what CAGR is. We’ll show you how to calculate it using Excel, provide practical examples, and explain its benefits.
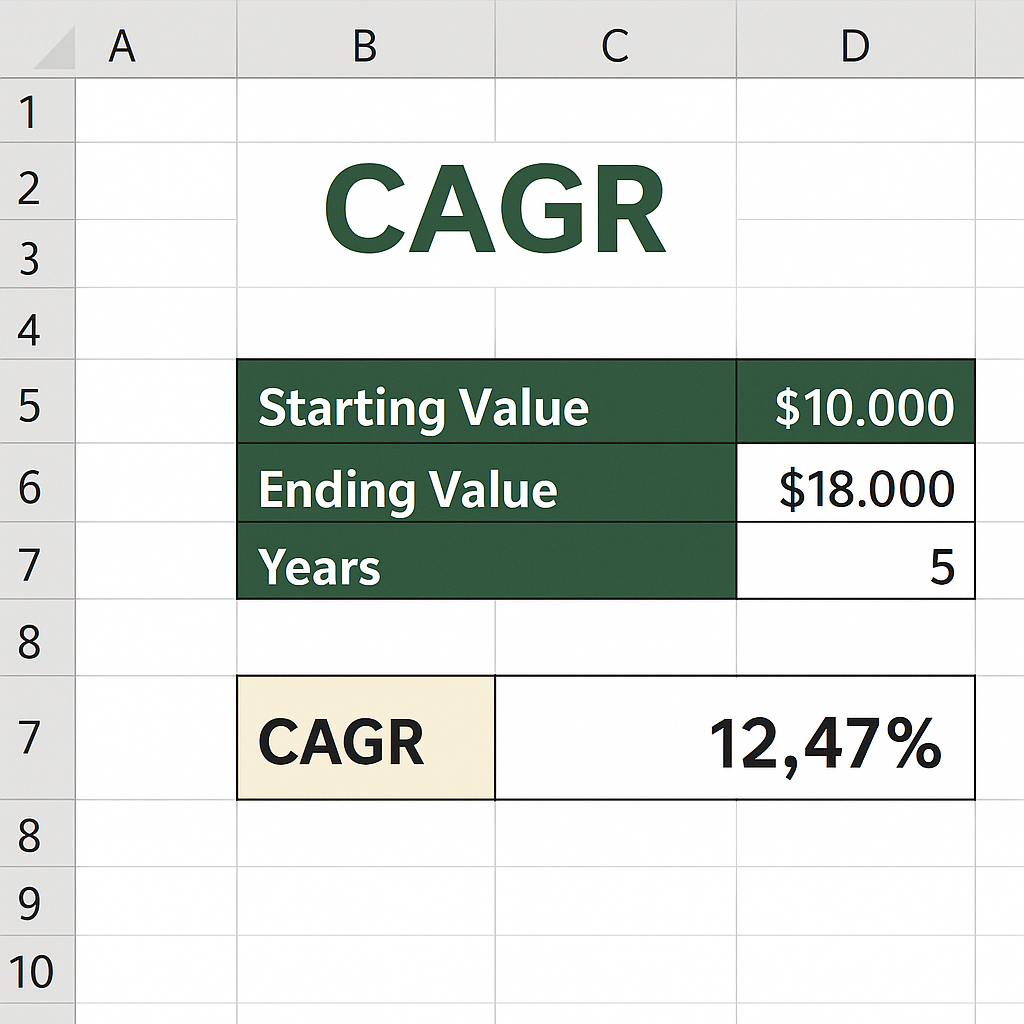
What is CAGR?
CAGR stands for Compound Annual Growth Rate. It is the rate at which an investment would grow if it grew at the same rate every year, compounding annually. CAGR is better than a simple average growth rate. It considers compounding over several years. This makes it more accurate for analyzing long-term growth.
CAGR is commonly used in:
- Investment performance analysis
- Revenue or profit growth evaluations
- Business forecasting
- Comparing the performance of assets over time
Mathematically, the CAGR formula is:
Where:
- Ending Value is the final amount
- Beginning Value is the initial amount
- n is the number of years
How to Calculate CAGR in Excel?
Excel is great for calculating CAGR. It has built-in functions and is easy to use. There are three common methods to calculate CAGR in Excel:
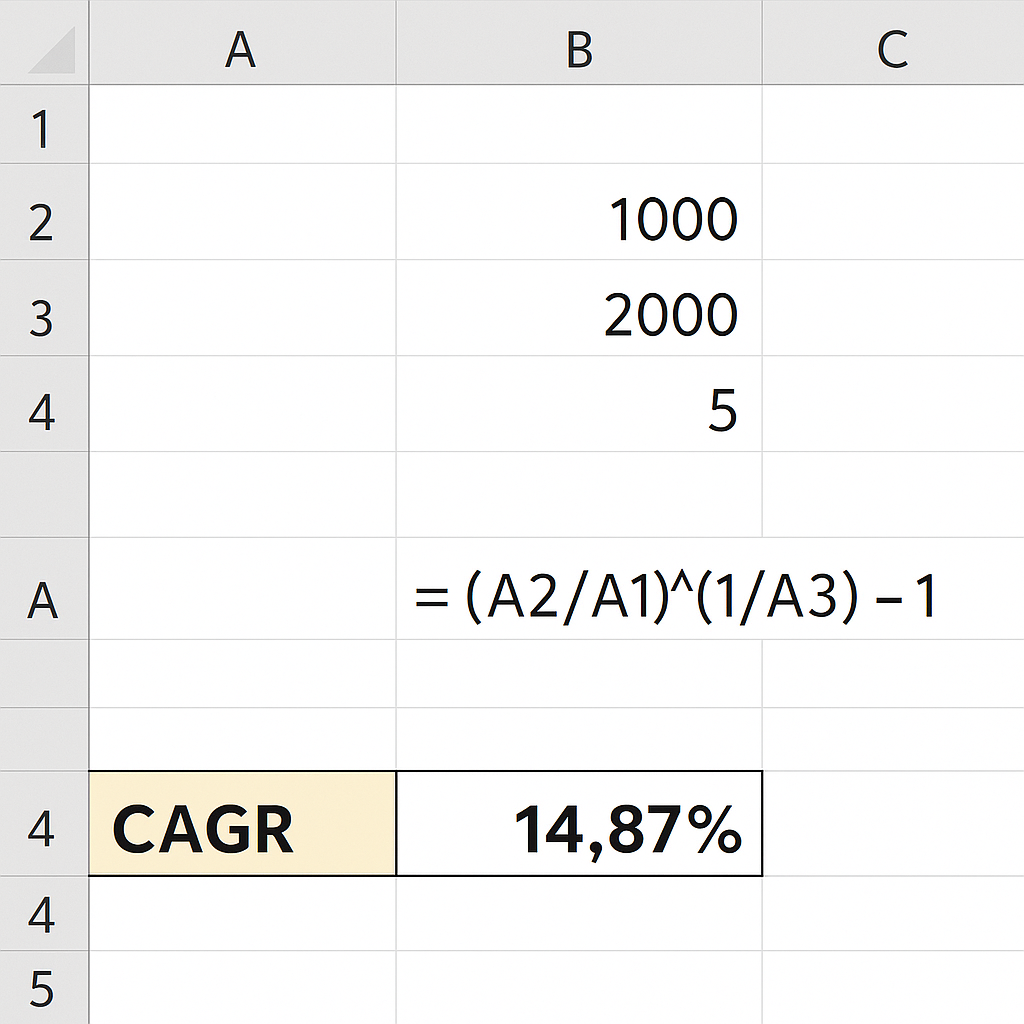
Method 1: Using the CAGR formula directly
- Enter the beginning value in cell A1 (e.g., 1000)
- Enter the ending value in cell A2 (e.g., 2000)
- Enter the number of years in cell A3 (e.g., 5)
- In cell A4, apply the formula:
= (A2/A1)^(1/A3) – 1
- Format the result in A4 as a percentage
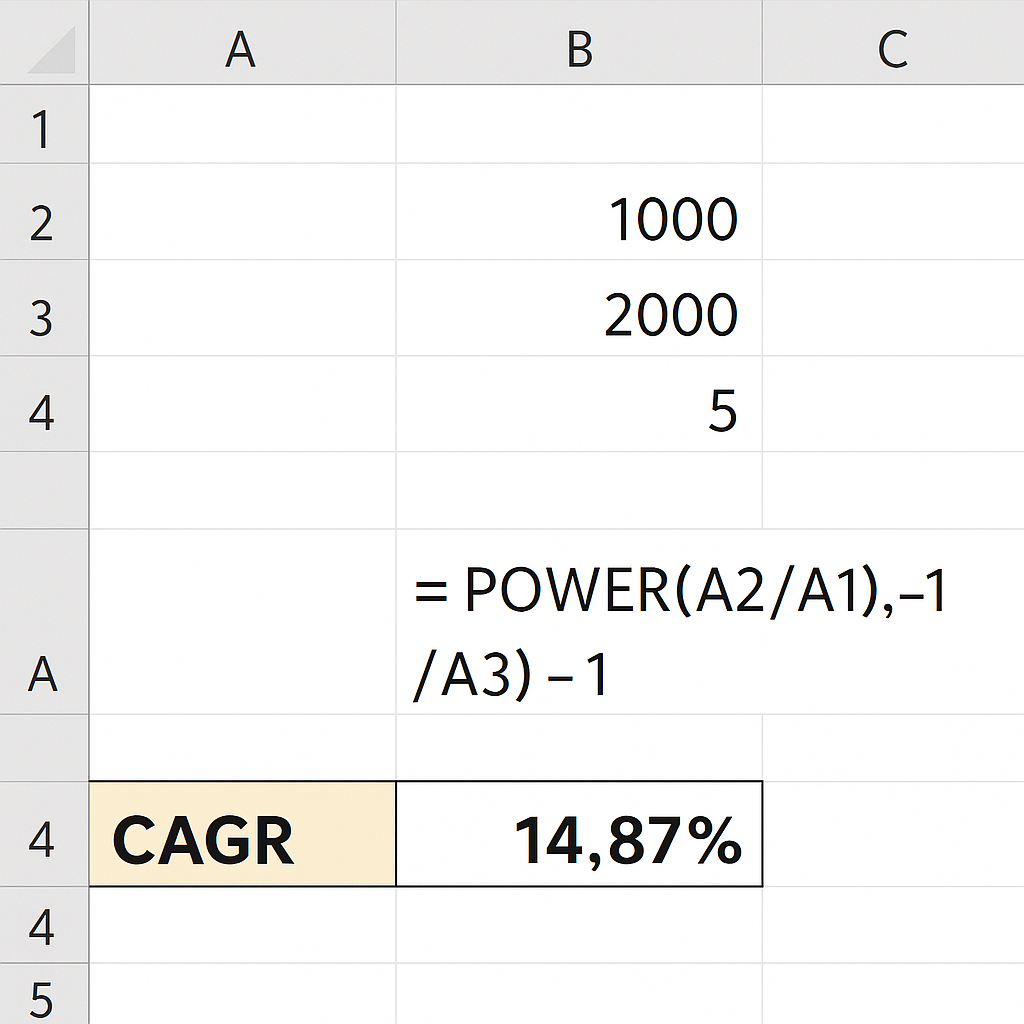
Method 2: Using the POWER function
Excel’s POWER function can simplify the calculation:
= POWER(A2/A1, 1/A3) – 1
This method is identical to Method 1 but uses a built-in function for the exponentiation part.
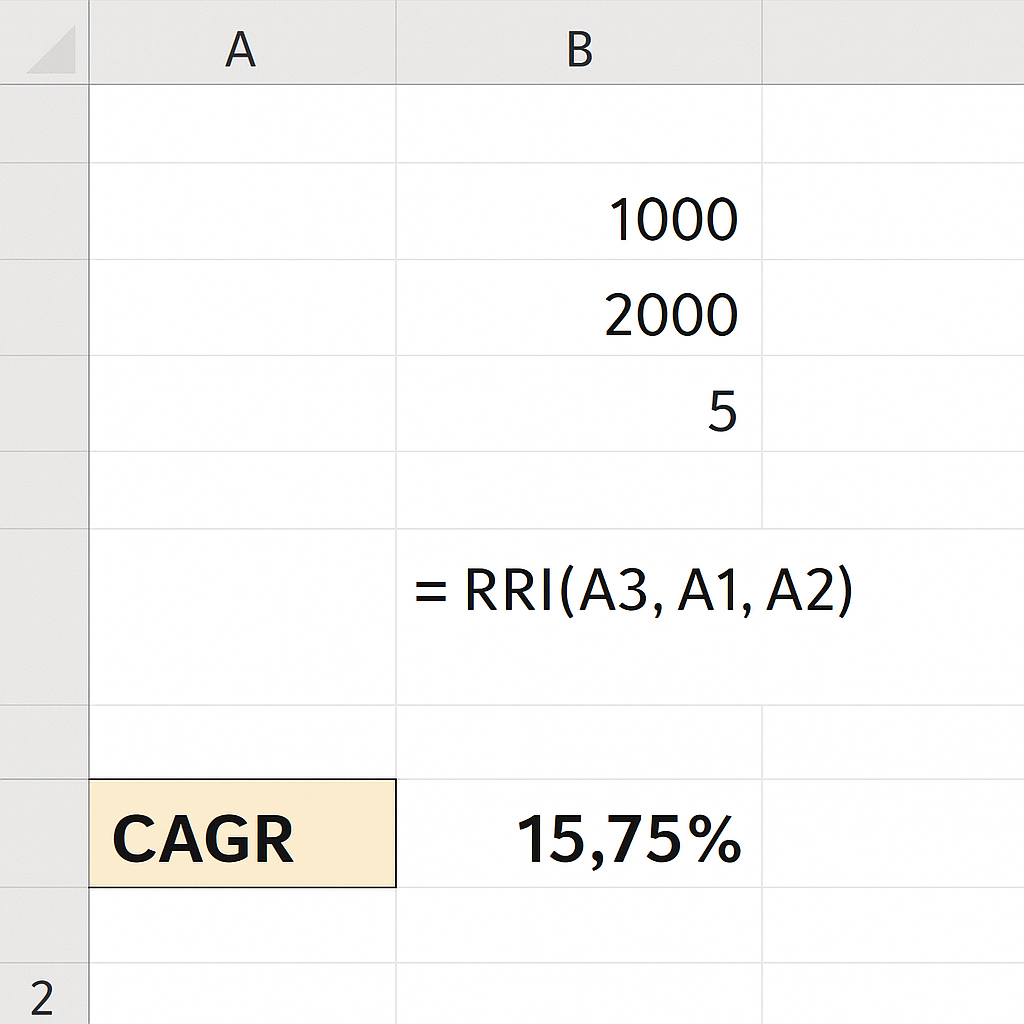
Method 3: Using the RRI function
Excel offers a dedicated financial function, RRI, to compute CAGR:
= RRI(A3, A1, A2)
This function returns the equivalent interest rate for the specified period. Format the result as a percentage.
Examples
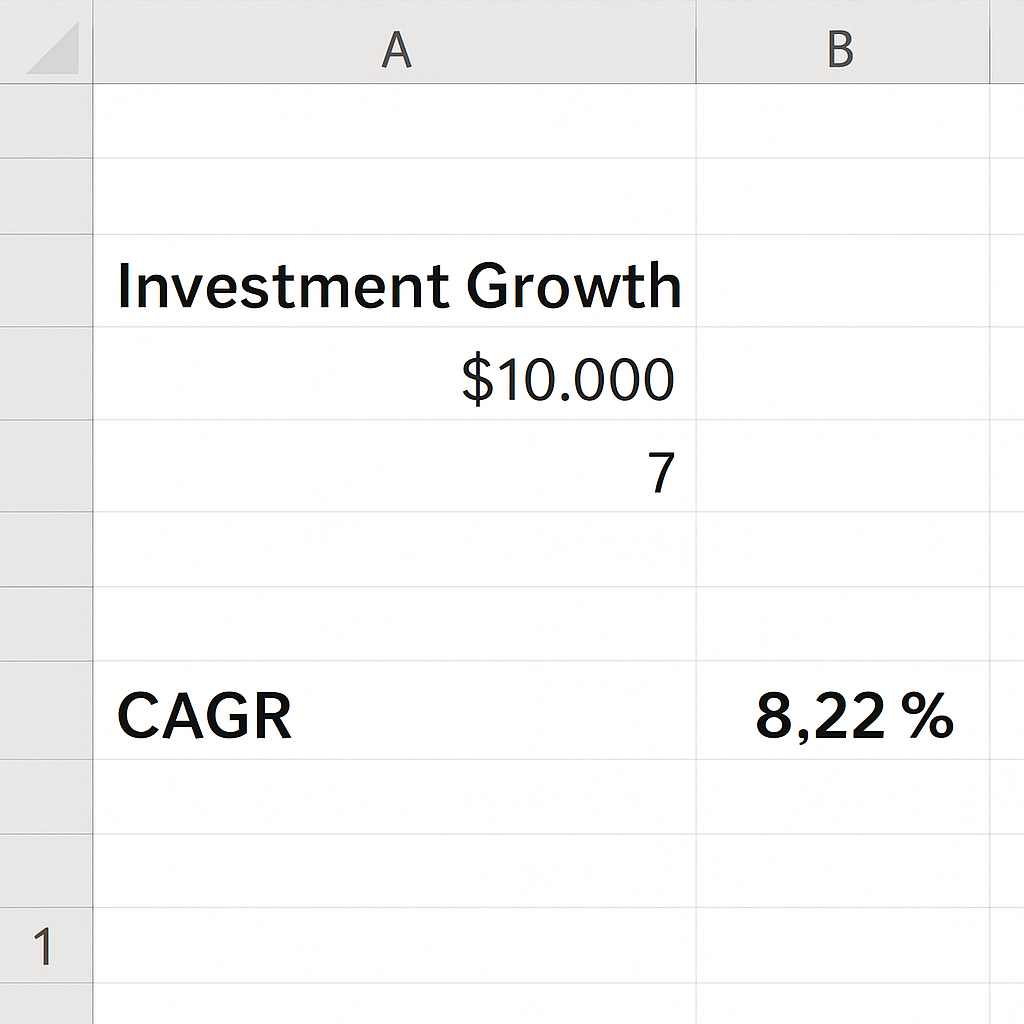
Example 1: Investment Growth
Suppose you invested $10,000 in a mutual fund, and after 7 years it grew to $17,000. The CAGR can be calculated using:
= (17000/10000)^(1/7) – 1
CAGR = 8.22%
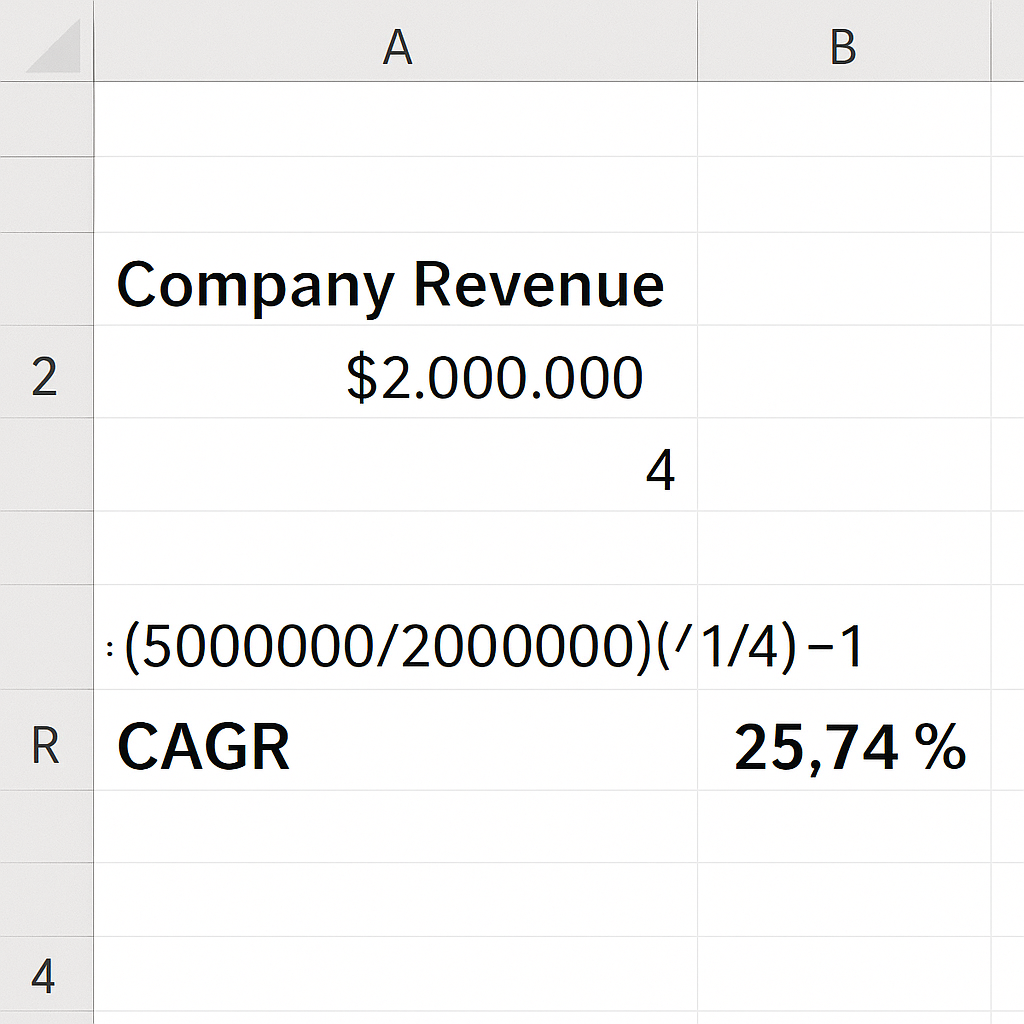
Example 2: Company Revenue
A company’s revenue grew from $2 million to $5 million in 4 years:
= (5000000/2000000)^(1/4) – 1
CAGR = 25.74%
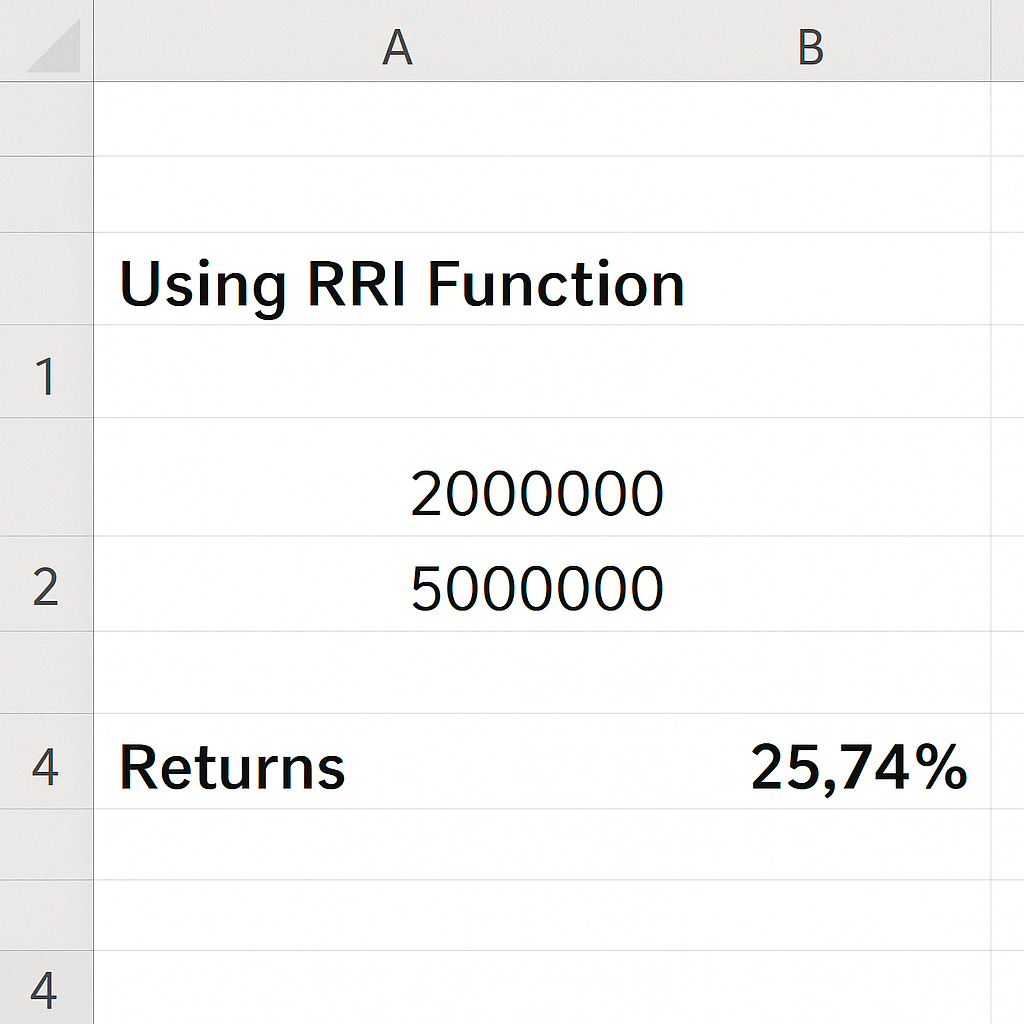
Example 3: Using RRI Function
Using the same revenue figures:
= RRI(4, 2000000, 5000000)
Returns 25.74%
Benefits of Calculating CAGR in Excel
- Simplifies complex growth calculations: Manually computing compound growth can be time-consuming. Excel simplifies tasks with formulas like POWER and RRI. This cuts down errors and saves time.
- Ensures accuracy in long-term performance analysis: By accounting for compounding, CAGR reflects the true rate of return or growth over time. It prevents misleading interpretations that can result from using simple averages.
- Makes comparisons more reliable:CAGR is useful for comparing investments, business performance, or KPIs over time. It works across different markets and sectors in a clear and consistent manner. This is especially useful for investors comparing mutual funds, stocks, or asset portfolios.
- Integrates well with financial models: CAGR can be integrated into broader financial models, dashboards, and forecasting templates in Excel. This enables deeper insights and more informed decision-making.
- Supports decision-making in business strategy: Executives and managers use CAGR to track revenue, profit, or user growth. Understanding whether growth is accelerating or slowing helps in planning future strategies.
- Visual Representation Through Charts: Excel allows you to pair CAGR calculations with line graphs or bar charts. This visual representation enhances understanding and presentation for stakeholders or clients.
CAGR Function and Formula in Excel | Calculate Compound Annual Growth Rate
FAQ’s
How is CAGR different from IRR? CAGR assumes a constant rate of growth, while IRR considers variable rates of return. IRR is more suitable for cash flows, whereas CAGR is ideal for simple start and end value analysis.
Is CAGR accurate for fluctuating growth?
CAGR simplifies fluctuations by assuming steady growth. For volatile growth, CAGR is an approximation, not a reflection of annual variance.
Can I automate CAGR calculation for multiple rows of data?
Yes. Use relative references in your formula and drag it down to apply it to multiple rows. You can also use array formulas or structured tables.
Can CAGR be used for population or user growth?
Absolutely. CAGR can be used for any metric that changes over time. This includes populations, subscribers, website visitors, and customers.
Conclusion
CAGR is a powerful metric to understand consistent growth over time. Excel makes calculating CAGR fast, accurate, and easy to scale. You can use it for analyzing financial performance, investments, or business metrics. This method fits well with data-driven decision-making. It also helps you share the complete story behind the numbers. Whether you’re a student, analyst, or entrepreneur, CAGR analysis can enhance your reports and dashboards. It provides better insights and helps you create smarter strategies.