
Knowing the cost of goods sold (COGS) is key for managing profits, setting prices, and financial reporting. No matter if you own a small business, work as a financial analyst, or sell online, calculating COGS in Excel can help. It can make your operations smoother and improve your profit accuracy. This guide covers COGS, shows how to calculate it in Excel step-by-step, provides examples, and explains the benefits of tracking it accurately.
What is COGS?
COGS (Cost of Goods Sold) is the direct cost of making or buying the goods a company sells in a given time. It includes:
- Raw materials
- Labor costs (for manufacturers)
- Shipping or delivery to warehouse
- Packaging (in some cases)
- Inventory purchases (for resellers)
It excludes indirect costs like marketing, rent, or salaries not involved in production.
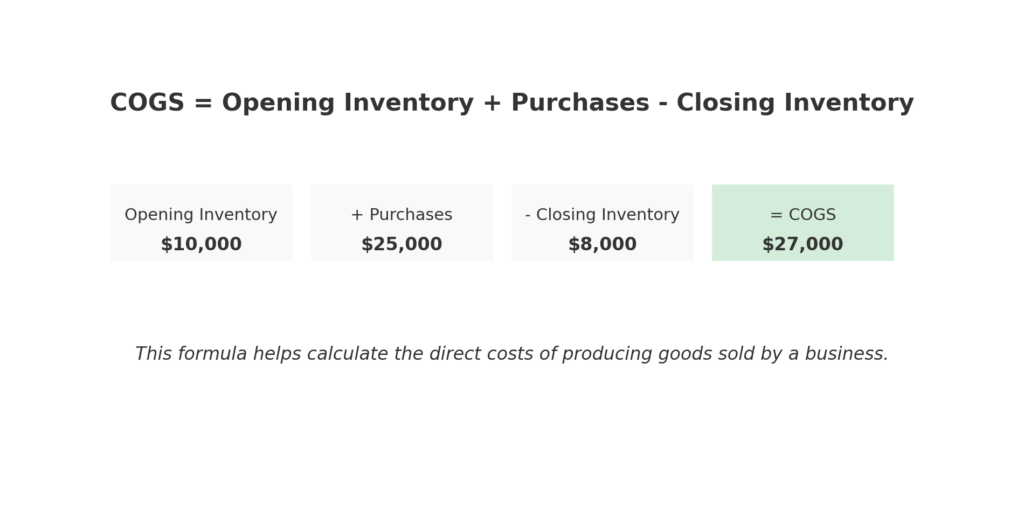
COGS Formula (Basic):
COGS = Beginning Inventory + Purchases – Ending Inventory
This formula applies whether you’re selling physical products or tracking manufacturing costs.
How to Calculate COGS in Excel (Step-by-Step)
You can easily set up a dynamic COGS calculator in Excel using structured formulas. Here’s how:
Step 1: Prepare Your Dataset
| Item | Beginning Inventory | Purchases | Ending Inventory |
| Product A | $5,000 | $3,000 | $2,000 |
| Product B | $10,000 | $4,000 | $5,000 |

Step 2: Enter the COGS Formula in a New Column
In a new column labeled COGS, use the formula:
=Beginning Inventory + Purchases – Ending Inventory
Example in Excel (cell D2):
=B2+C2-D2
You’ll get:
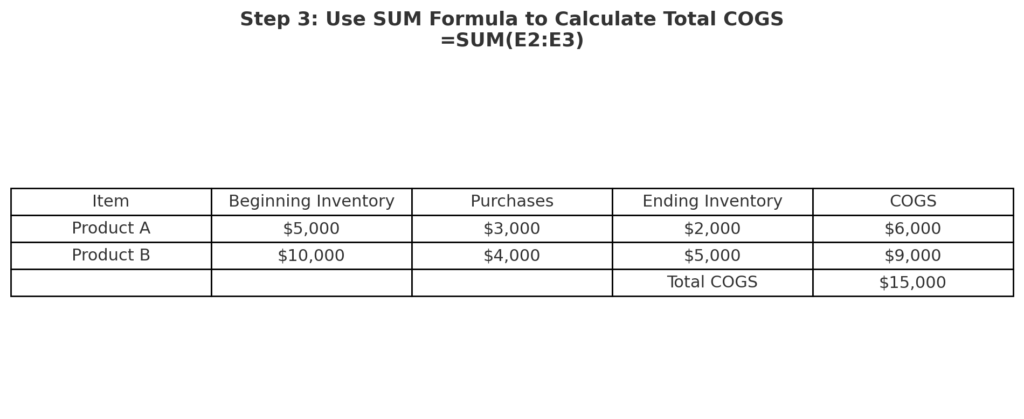
| Item | Beginning Inventory | Purchases | Ending Inventory | COGS |
| Product A | $5,000 | $3,000 | $2,000 | $6,000 |
| Product B | $10,000 | $4,000 | $5,000 | $9,000 |

Step 3: Use SUM for Total COGS
To calculate the total cost of goods sold for the period:
=SUM(E2:E3)
This gives a total across all listed products.
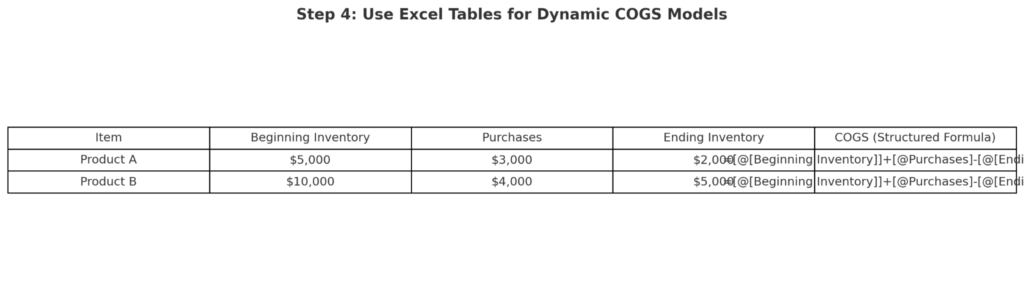
Step 4: Optional – Use Named Ranges or Tables for Dynamic Models
If your dataset is large, consider converting it into an Excel Table:
- Select your data → Press Ctrl + T
- Use column names in formulas like:
=[[@[Beginning Inventory]]]+[@Purchases]-[@[Ending Inventory]]
This approach ensures clarity and flexibility in reports.
Examples of Calculating COGS in Excel
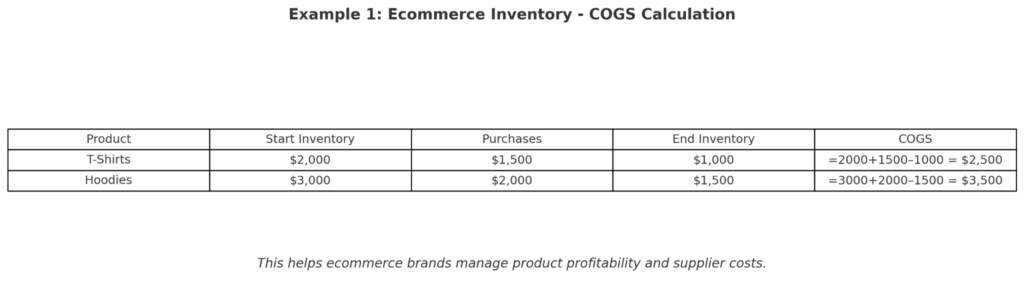
Example 1: Ecommerce Inventory
| Product | Start Inventory | Purchases | End Inventory | COGS |
| T-Shirts | $2,000 | $1,500 | $1,000 | =2000+1500–1000 = $2,500 |
| Hoodies | $3,000 | $2,000 | $1,500 | =3000+2000–1500 = $3,500 |
This helps ecommerce brands manage product profitability and supplier costs.
Example 2: Manufacturing Firm
| Item | Start Inventory | Raw Material Purchases | End Inventory | COGS |
| Widgets | $8,000 | $6,000 | $3,000 | $11,000 |
Manufacturers use this method to tie COGS to production cycles and budgeting.
Benefits of Calculating COGS in Excel
Improved Profitability Insights
Calculating COGS correctly helps you find gross profit margins. This is a key financial KPI. Gross profit = Revenue – COGS. Excel shows you which products make the most profit and which need cost changes.
Real-Time Inventory Cost Management
Excel allows:
- Automated updates through linked sheets or databases
- What-if analysis for changing inventory levels
- Scenario planning based on sales forecasts
You gain real-time visibility into inventory-driven costs.
Financial Reporting Accuracy
Businesses must report COGS on financial statements. Excel-based tracking ensures:
- Transparency for audits
- Error-free inputs into accounting systems
- Compliance with tax or regulatory bodies
Scalability for Growing Businesses
Whether you track 5 SKUs or 5,000, Excel formulas and tables scale effortlessly. You can:
- Filter by category
- Analyze monthly/quarterly trends
- Export reports for stakeholders
Customization for Any Business Model
Excel lets you modify the COGS formula for:
- Service-based models (labor + materials)
- Wholesale pricing analysis
- Multi-warehouse inventory tracking
The flexibility empowers businesses across industries.
how to calculate cost of goods sold COGS | find cost of goods sold | what is cost of goods sold
FAQ’s: COGS in Excel
What if I don’t have beginning inventory data?
If it’s your first month in business, you can set Beginning Inventory = 0. Start tracking accurately from that point forward.
Can Excel automatically update COGS from sales data?
Yes, if you link your sales and inventory sheets. Use dynamic references or Power Query to sync live data into COGS formulas.
Is COGS the same as expenses?
No. COGS covers direct production or procurement costs. Expenses include marketing, salaries, utilities, and more.
How often should I update COGS in Excel?
Monthly is ideal for reporting. However, weekly or real-time updates are best for inventory-heavy businesses or high-volume sellers.
Can I use Excel to forecast future COGS?
Absolutely. Use historical COGS data and Excel’s forecasting tools to predict future trends. You can also apply regression functions for better accuracy.
Conclusion
Calculating COGS in Excel is crucial for business owners, financial managers, and analysts. Excel is a powerful tool for tracking physical inventory and calculating production costs. It helps you measure and manage direct expenses flexibly.