
Analyzing data in fields like education, economics, finance, or marketing is crucial. It’s important to know how values spread in a dataset. Decile analysis is one of the best ways to do that. Excel offers strong tools to quickly and accurately calculate deciles. This helps you understand performance, income distribution, customer segments, and more. In this guide, you’ll learn about deciles. You’ll see how to calculate deciles in Excel. We’ll share practical examples and explore the benefits. You’ll also find answers to common questions.
What is a Decile?
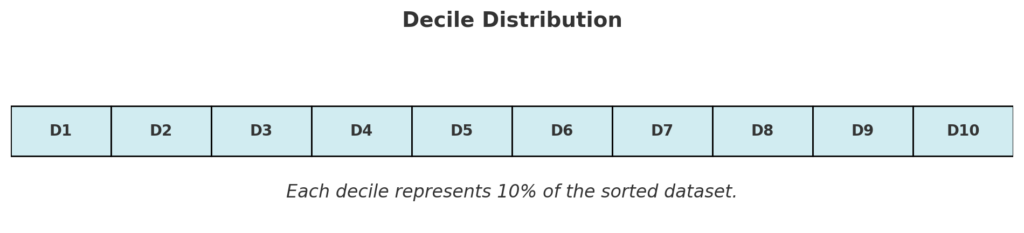
A decile is a statistical term that divides a dataset into ten equal parts. Each part (or “decile”) represents 10% of the data, ranked from lowest to highest.
- 1st decile (D1) = bottom 10%
- 2nd decile (D2) = bottom 20%
- 9th decile (D9) = bottom 90%
Where Deciles Are Used:
- Education: Ranking students by test scores
- Finance: Assessing income inequality or credit risk
- Marketing: Segmenting customers based on purchase frequency
- Real Estate: Analyzing property values across regions
How to Calculate Decile in Excel (Step-by-Step)
There are two main ways to calculate deciles in Excel: using PERCENTILE.INC and PERCENTILE.EXC functions.
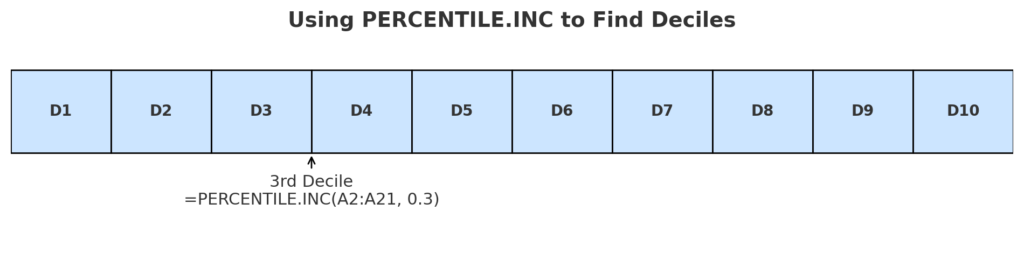
Method 1: Using PERCENTILE.INC (Inclusive Method)
This method includes the 0th and 100th percentiles in the calculation.
Syntax:
=PERCENTILE.INC(array, k)
- array = the range of values
- k = the percentile (e.g., 0.1 for 1st decile, 0.2 for 2nd decile, etc.)
Example: To calculate the 3rd decile from data in A2:A21:
=PERCENTILE.INC(A2:A21, 0.3)
This gives the value below which 30% of the data falls.
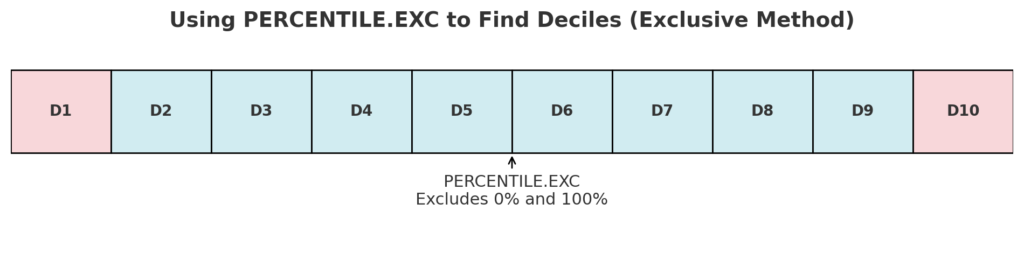
Method 2: Using PERCENTILE.EXC (Exclusive Method)
This excludes the lowest and highest values (0% and 100%) and is better for large datasets.
Syntax:
=PERCENTILE.EXC(array, k)
This works the same way as PERCENTILE.INC but may yield slightly different results.
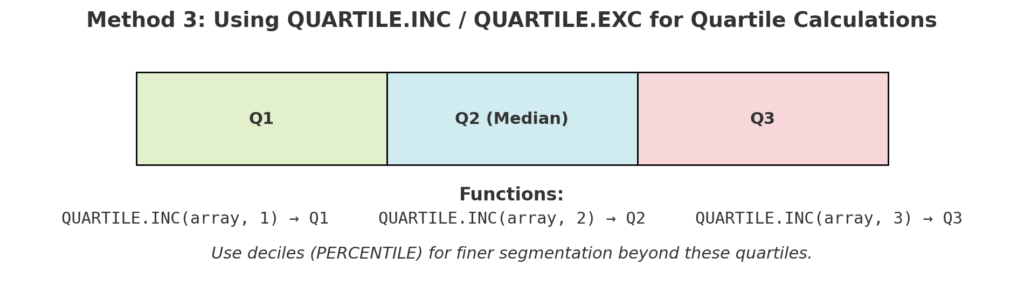
Method 3: Using QUARTILE.INC and QUARTILE.EXC (for special cases)
Though designed for quartiles, these functions support:
- 1 for Q1
- 2 for Q2 (median)
- 3 for Q3
Use deciles for more detailed segmentation than quartiles.
Examples of Decile Calculation in Excel
Example 1: Student Score Ranking
| Student | Score |
| A | 45 |
| B | 62 |
| C | 70 |
| T | 91 |
To find the 7th decile:
=PERCENTILE.INC(B2:B21, 0.7)
This shows the score below which 70% of students fall.
Example 2: Income Distribution
| Household | Monthly Income |
| 1 | $1,000 |
| 2 | $2,300 |
| … | … |
| 100 | $9,500 |
To find the 9th decile:
=PERCENTILE.EXC(B2:B101, 0.9)
Used by economists to track inequality or determine benefits eligibility.
Benefits of Calculating Deciles in Excel
Deeper Data Segmentation
Deciles split your data into 10 equal parts. This gives you a clearer view than quartiles or medians. This is essential for:
- Performance benchmarking
- Income stratification
- Targeted marketing
Informed Decision-Making
With deciles, decision-makers can:
- Identify top 10% or bottom 10% performers
- Create incentives or alerts based on performance bands
- Understand population trends more clearly
Customizable Across Use Cases
Excel formulas allow you to:
- Apply deciles to dynamic datasets
- Combine with conditional formatting
- Filter and visualize data by decile groups
This makes it valuable in HR, academia, sales, and beyond.
Data-Driven Strategy Building
For marketers and business analysts, deciles help:
- Target top-spending customers
- Analyze churn risk in lower segments
- Allocate budgets based on customer value
Excel makes this strategic use of data fast, flexible, and transparent.
Time-Saving Automation
Once your formula is set up, Excel automatically:
- Updates decile values with new data
- Supports dashboards and reports
- Removes manual sorting or external tools
This saves hours of data processing each month.
How To Calculate Quartiles, Deciles, and Percentiles In Excel
Frequently Asked Questions (FAQ’s)
What’s the difference between deciles and percentiles?
A decile divides data into 10 equal parts, while a percentile divides it into 100 parts. D1 = 10th percentile, D5 = 50th percentile, etc.
Can I assign decile numbers to each row of data?
Yes. Use the RANK.EQ and ROUNDUP functions:
=ROUNDUP(RANK.EQ(A2, $A$2:$A$101)/COUNT($A$2:$A$101)*10, 0)
This assigns each value to a decile group (1–10).
Can I visualize deciles in Excel?
Yes. Use:
- Conditional formatting (color scale by decile)
- Bar or column charts grouped by decile ranges
- Histograms or box plots for deeper insights
What if I get a #NUM! error?
This usually means:
- You used PERCENTILE.EXC on a dataset that’s too small
- The percentile value (k) is outside the 0–1 range
Conclusion
Learning how to calculate decile in Excel empowers you to go beyond basic analysis. Deciles give you a clear look at performance, pricing, income, and customer behavior. They help you make better decisions. Excel lets you control your data with simple formulas like =PERCENTILE.INC(range, k). This prepares you for advanced segmentation, reporting, and generating insights.