

In statistical analysis, understanding the concept of degrees of freedom (DF) is essential. Degrees of freedom matter for t-tests, ANOVA, and regression analysis. They help you assess the accuracy of your results and the validity of your conclusions. For students, researchers, and analysts using Excel, calculating degrees of freedom is important. This guide explains degrees of freedom, how to calculate them in Microsoft Excel, and their importance in real-world statistics.
What is Degrees of Freedom?
Degrees of freedom (DF) are the number of values that can change in a statistical calculation. It’s a key idea in statistics. It helps estimate population parameters, test hypotheses, and assess variability.

In Simple Terms:
Degrees of freedom show how many data points can change freely. They are not limited by any constraints.
Common Use Cases:
- t-tests (independent or paired sample)
- ANOVA (Analysis of Variance)
- Chi-square tests
- Regression models
For example, in a sample of 10 observations, only 9 can vary freely. The 10th is fixed once the mean is set. So, the degrees of freedom is n – 1.
How to Calculate Degrees of Freedom in Excel?
Excel offers different methods to calculate degrees of freedom based on the statistical test you use.
For a One-Sample t-Test
Formula:
=COUNT(A2:A11) – 1
- COUNT(A2:A11) returns the number of data points.
- Subtract 1 to get degrees of freedom for one-sample tests.
For an Independent Two-Sample t-Test
Formula:
=COUNT(Range1) + COUNT(Range2) – 2
Use this formula when comparing two independent groups.
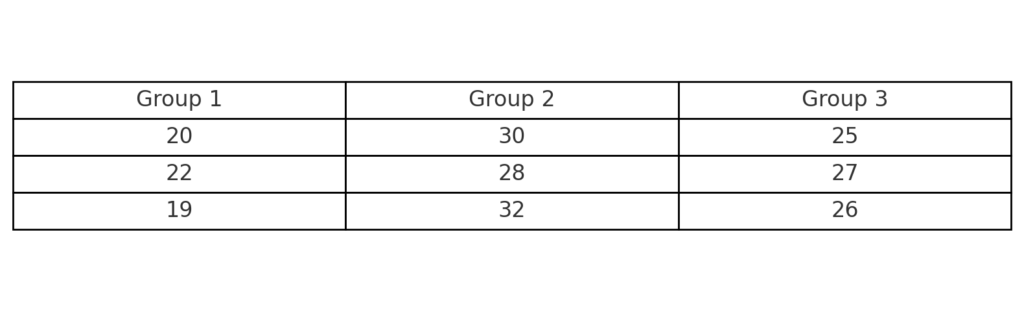
For ANOVA (One-Way)
Between Groups DF:
=Number_of_Groups – 1
Within Groups DF:
=Total_Observations – Number_of_Groups
Total DF:
=Total_Observations – 1
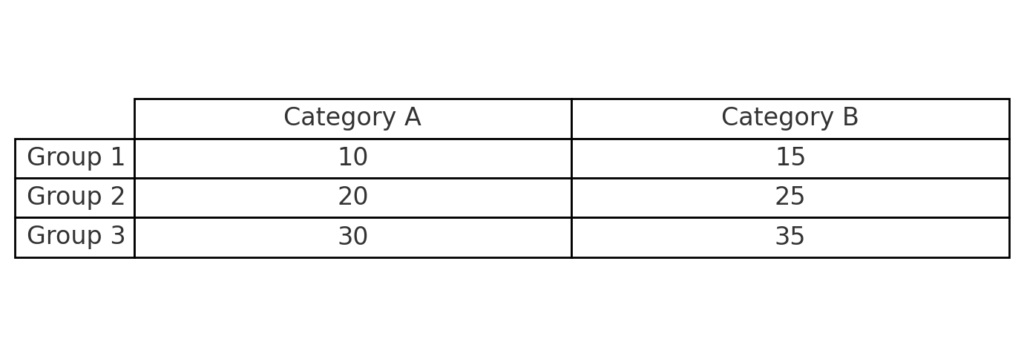
For Chi-Square Test
Formula:
=(Number_of_Rows – 1) * (Number_of_Columns – 1)
Use this formula when analyzing categorical data in a contingency table.
Examples of Degrees of Freedom in Excel
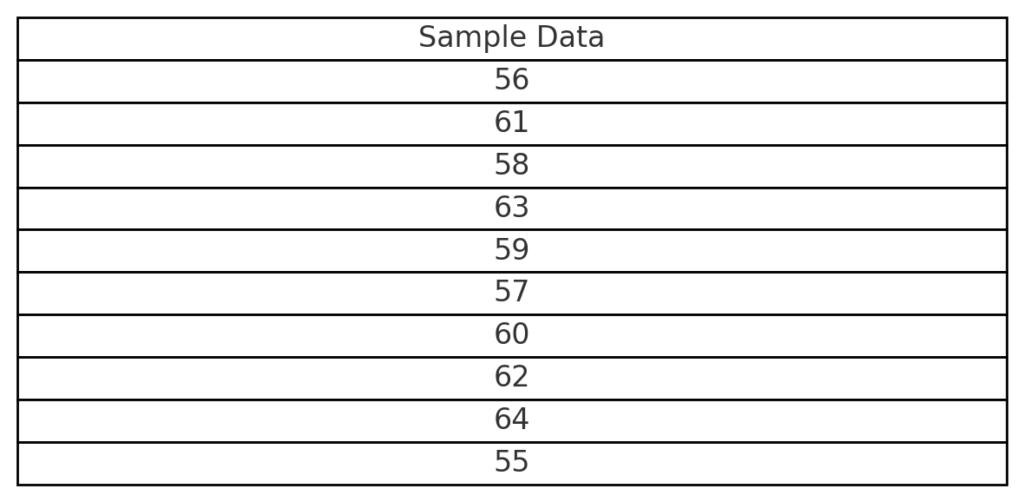
Example 1: One-Sample t-Test
You have test scores in cells A2:A11.
To find DF:
=COUNT(A2:A11) – 1
If there are 10 values, the result will be 9 degrees of freedom.

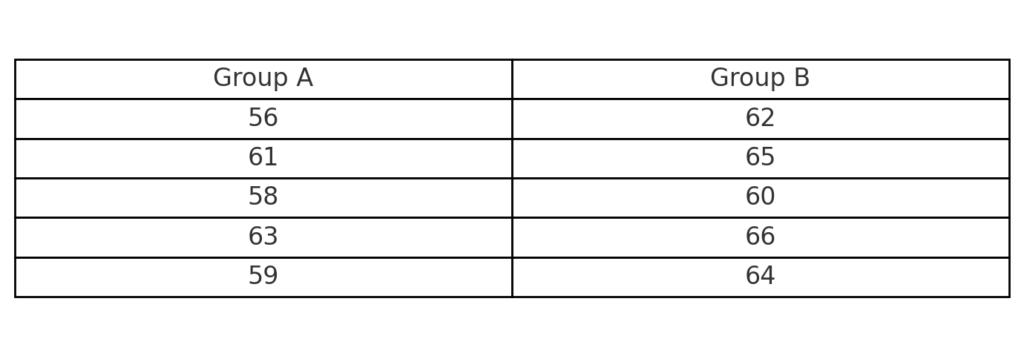
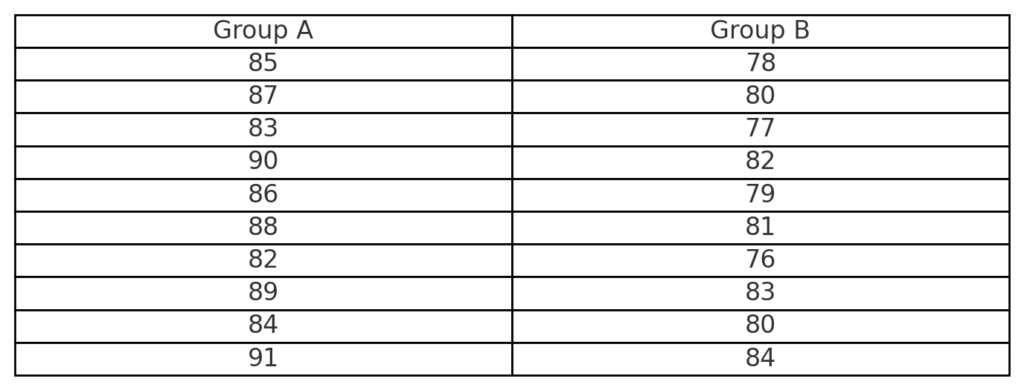
Example 2: Comparing Two Groups
Group A in B2:B11, Group B in C2:C11 Formula:
=COUNT(B2:B11) + COUNT(C2:C11) – 2
This gives you the correct DF for performing a two-sample t-test.
Benefits of Calculating Degrees of Freedom in Excel
Precision in Statistical Testing
Calculating degrees of freedom is key. It helps ensure your statistical tests, like t-tests or ANOVA, are accurate. This leads to valid conclusions with the right confidence levels.
Supports Advanced Analysis
Degrees of freedom are essential for hypothesis testing, regression modeling, and experimental design. Excel lets users run strong, real-world statistical tests using formulas.
Real-Time Calculation with Dynamic Data
Link your degrees of freedom formulas to live datasets in Excel. They will update automatically as your data grows. This keeps your results accurate and saves you time.
Accessible for Non-Statisticians
Excel is a simple tool for calculating complex stats, like degrees of freedom. You don’t need special software to do it.
Critical for Research and Academic Work
Accurate DF calculations matter. They help interpret student assignments and peer-reviewed research. This accuracy is key for defending findings with strong statistics.
FAQ’s
What is the general formula for degrees of freedom in statistics?
The most common formula is n – 1, where n is the sample size.
Can I calculate degrees of freedom in Excel without using built-in statistical tools?
Yes, you can use basic formulas like =COUNT(range) – 1 or custom logic based on the test type.
Does Excel automatically calculate degrees of freedom in functions like T.TEST?
Yes, functions like T.TEST, ANOVA, and LINEST manage degrees of freedom automatically. However, knowing how to calculate it manually helps with understanding.
Why is degrees of freedom important in statistical analysis?
Degrees of freedom shape distribution curves. This affects p-values and confidence intervals, which are key to data-driven decisions.
Conclusion
Calculating degrees of freedom in Excel helps you run accurate statistical tests. It builds your confidence in understanding data. This leads to trustable research or business reports. Understanding this concept in Excel helps everyone, from students using t-tests to data analysts with regression models. It makes your results more reliable.