
Saved to DriveKnowing the financial health of a project or investment is key. That’s where Net Present Value (NPV) helps. In this guide, you’ll discover what NPV means. You’ll see the NPV formula and learn how to calculate NPV in Excel. We’ll provide step-by-step examples. Lastly, we’ll explain why NPV is a favorite tool for financial decision-makers. Net Present Value (NPV) helps determine if a business project or investment is worth it. NPV shows how profitable an investment might be. It compares the current value of expected future cash flows to the initial cost. This takes into account the time value of money.
")
What is NPV?
Net Present Value (NPV) shows the difference between cash inflows and outflows today. It measures this over a certain time. It helps you see if an investment is profitable. It does this by looking at the time value of money. If the NPV is positive, the investment is considered profitable; if it’s negative, it may lead to a loss. Excel’s built-in financial functions make complex calculations quick and easy. This simplicity makes it a favorite for professionals around the globe.
What is the NPV Formula?
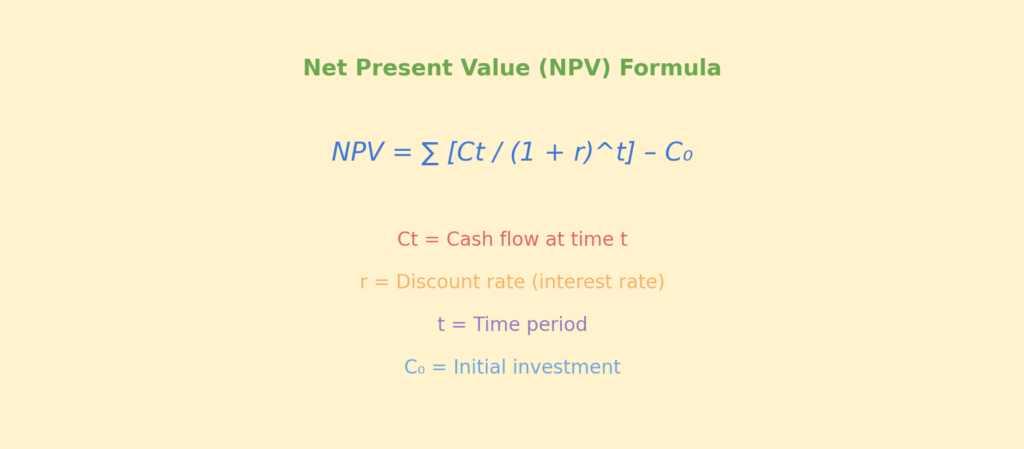
The standard NPV formula is:
NPV = ∑ [Ct / (1 + r)^t] – C0
Where:
C0 = Initial investment
Ct = Cash flow at time t
r = Discount rate (interest rate)
t = Time period
In simple terms, NPV calculates today’s value of future cash flows minus the upfront cost.
How to Calculate Net Present Value in Excel?
Excel makes NPV calculation straightforward with its built-in NPV function. Here’s how to do it:
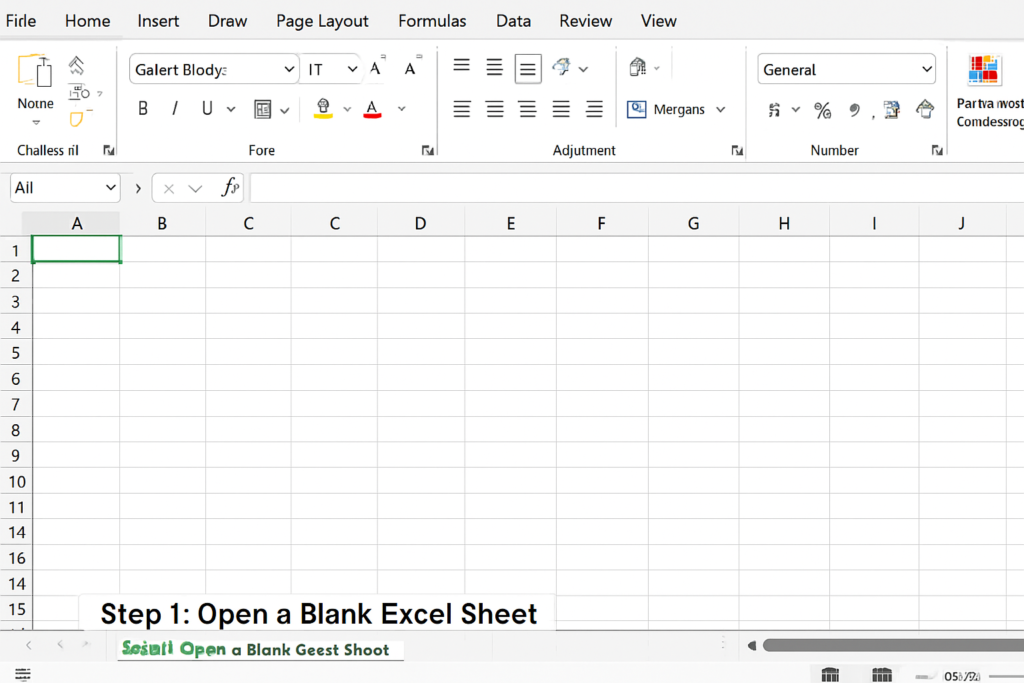
Step 1: Open a Blank Excel Sheet
Start by opening a new Excel workbook. This will let you start fresh with your investment data. You can use the NPV formula without any distractions from other calculations.
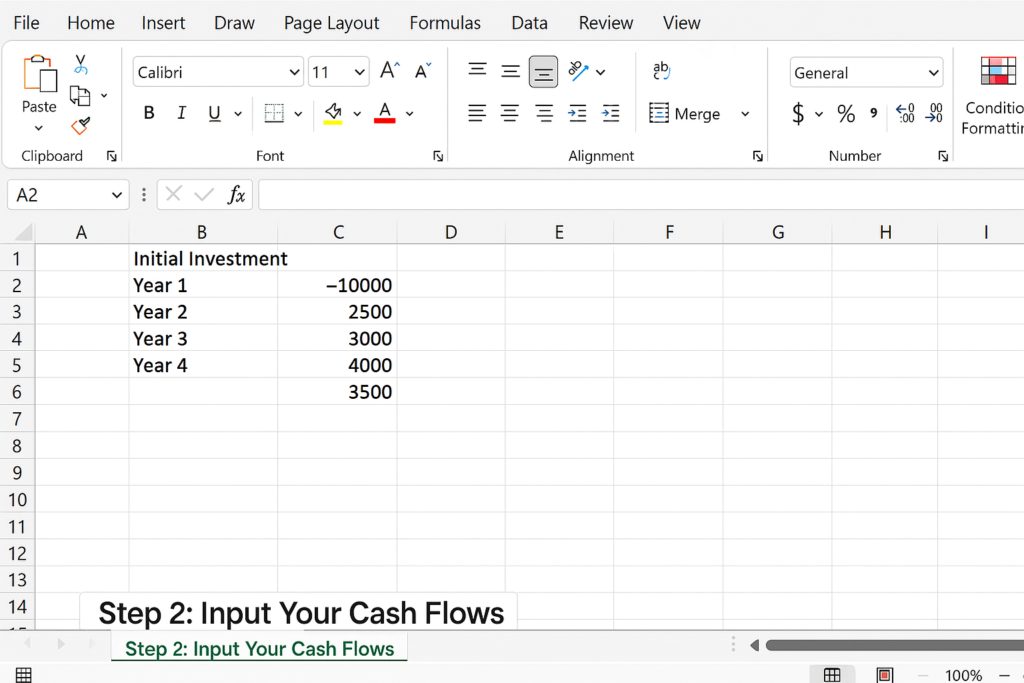
Step 2: Input Your Cash Flows
Structure your cash flow data clearly. Enter:
- Initial Investment (usually negative) in cell B2
- Year 1 to Year N inflows in cells B3 and downward
Example:
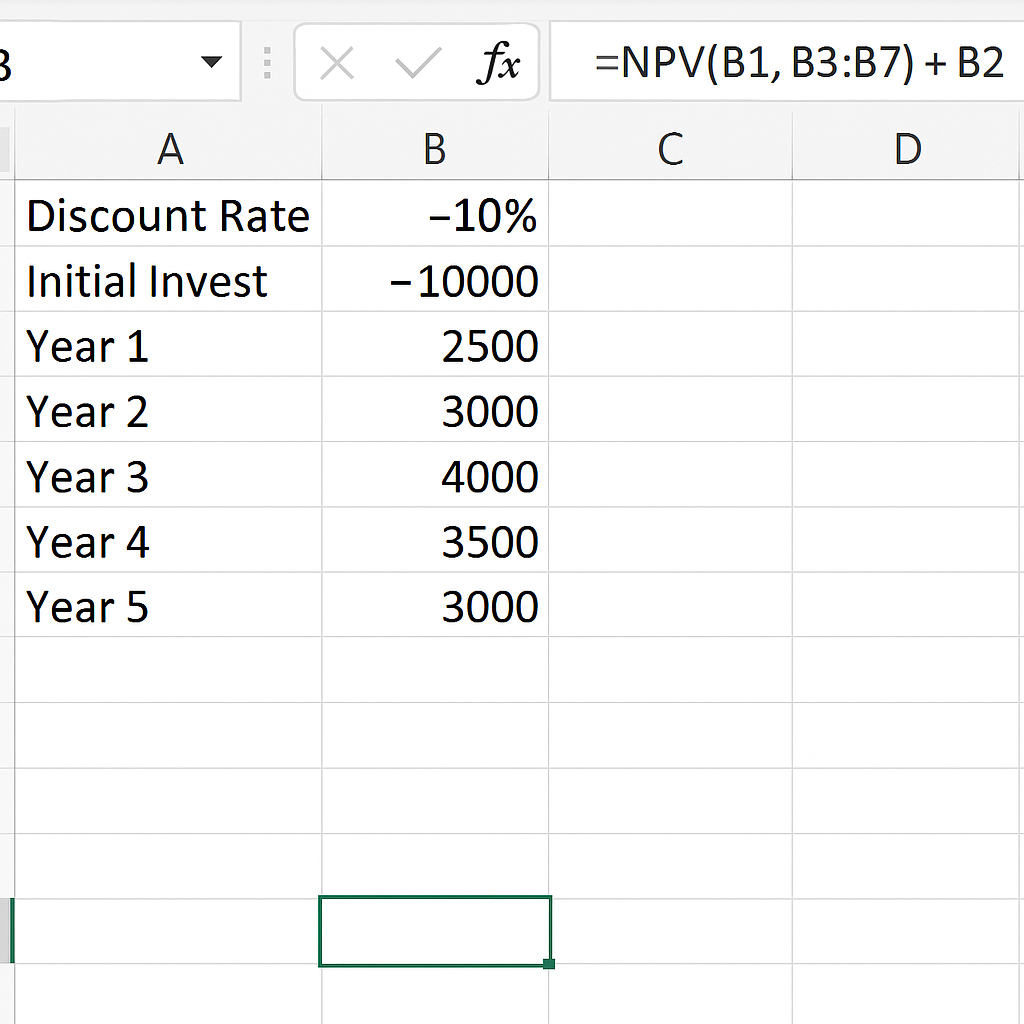
B2: -10000 B3: 2500 B4: 3000 B5: 4000 B6: 3500 B7: 3000
�� Tip: Always enter your initial investment as a negative number because it’s money going out.
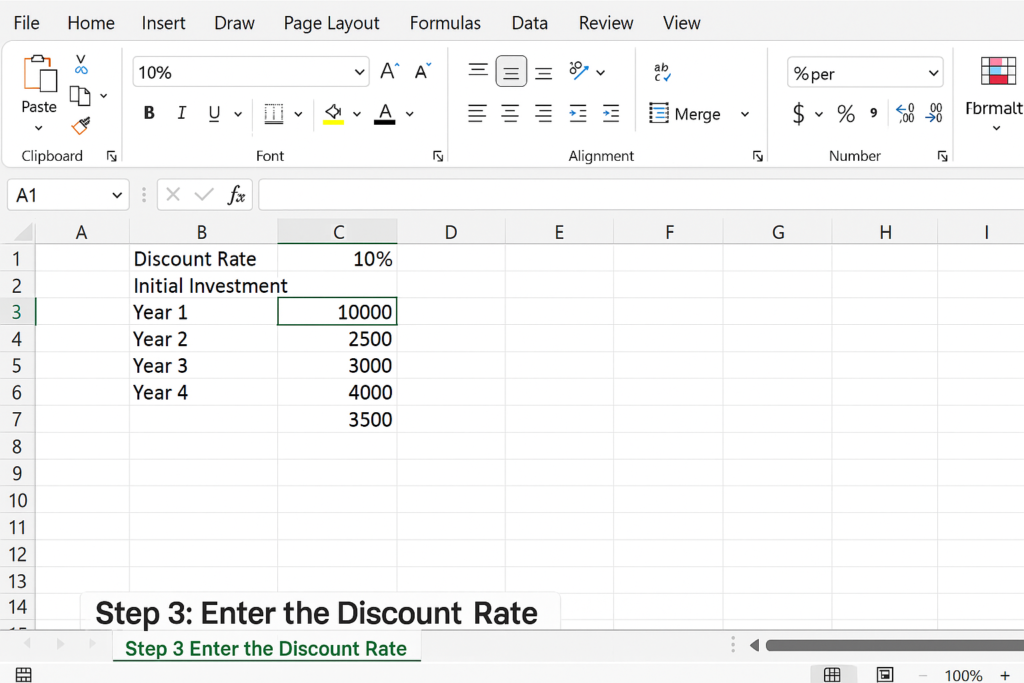
Step 3: Enter the Discount Rate
Type your discount rate (as a decimal or percentage) in another cell—e.g., 10% in cell B1. This represents your required rate of return or cost of capital.
Step 4: Use the NPV Formula in Excel
Now apply the NPV function. Use this formula in any empty cell (e.g., B9):
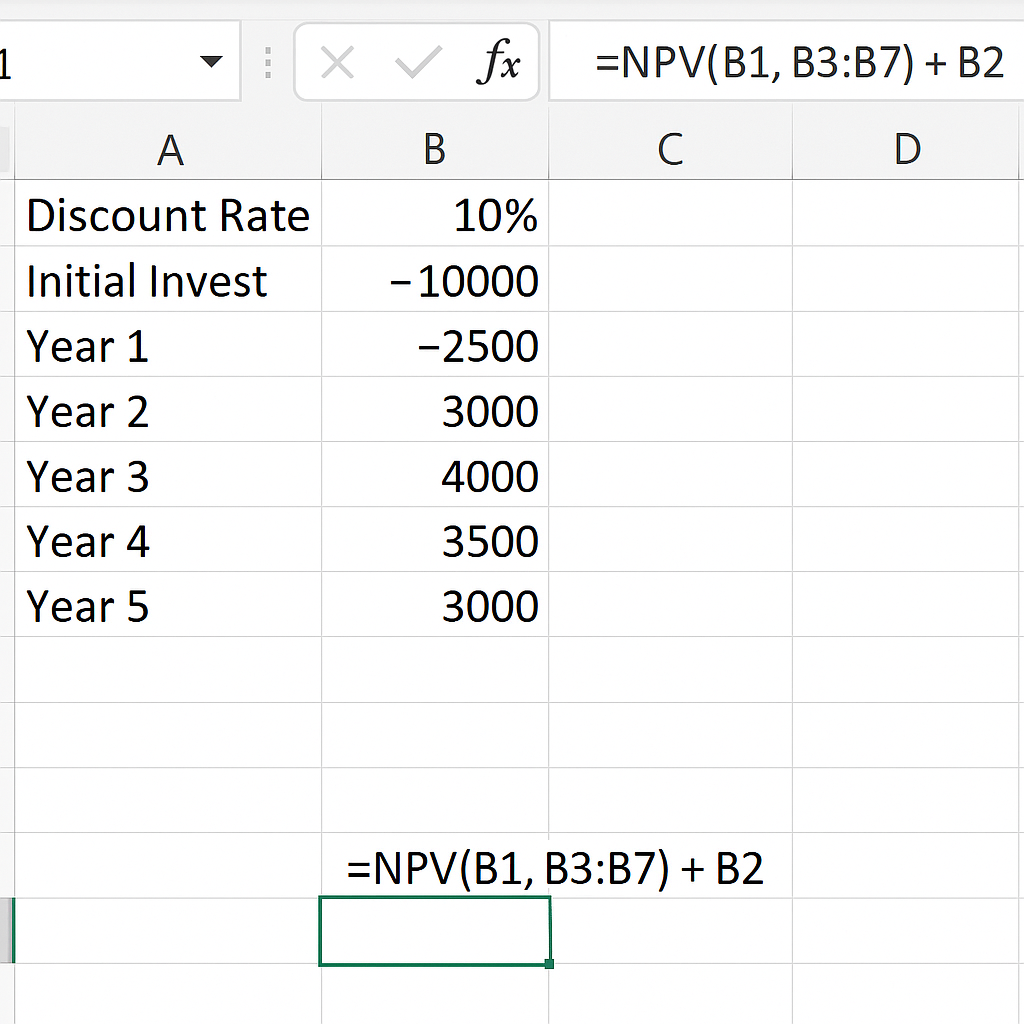
=NPV(B1, B3:B7) + B2
- B1 = Discount rate
- B3:B7 = Future cash flows (Years 1 to 5)
- B2 = Initial investment (added separately)
Excel’s NPV function starts counting cash flows from year 1. You need to add the initial investment yourself.
Step 5: Press Enter and View the Result
Once you hit Enter, Excel will display the Net Present Value. If the result is positive, the investment is likely profitable. If it’s negative, it may not meet your required return.
Example for NPV Calculation in Excel
You’re considering an investment in a new marketing campaign. The project requires an initial investment of $12,000, and you expect to generate the following returns over the next 5 years:
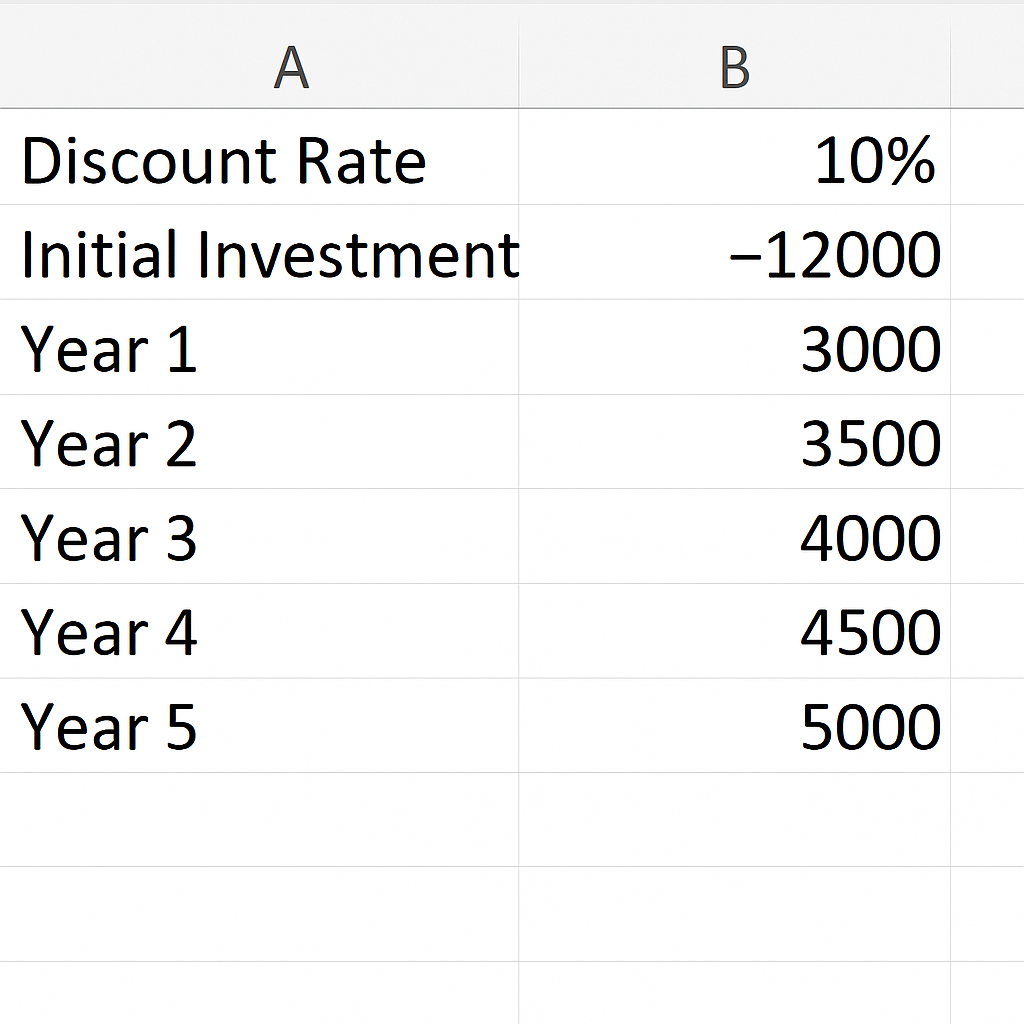
You’ve decided to use a discount rate of 10% to calculate the present value of future cash flows.
Benefits of NPV Calculation in Excel
Saves Time with Built-in Functions:Excel has a special NPV function. It removes the need to calculate the present value of each cash flow manually. Just input your rate and range of values. This saves hours of work, especially for multi-year projects. No need for complex math!
- Reduces Human Error: Calculating NPV by hand can cause mistakes. This happens often with many time periods due to formula or rounding errors. Excel automates these calculations with precision, ensuring accuracy every time.
- Allows Easy Scenario Analysis: Want to know what happens if your discount rate changes from 10% to 12%? Or if cash flows increase by 15% in Year 3? Excel lets you quickly change values and see updated NPV results right away. This is perfect for stress testing and predicting different outcomes.
- Supports Clear Data Visualization: You can use Excel to build dynamic charts or dashboards alongside your NPV values. This helps stakeholders see ROI trends and financial health. It makes your reports functional and visually appealing.
- Scalable for Complex Projects: Excel works for a 3-year marketing campaign or a 20-year infrastructure investment. You can add inflation, taxes, or maintenance costs by expanding the sheet. This makes it great for real-world corporate finance modeling.
How to Calculate NPV (Net Present Value) in Excel
FAQ’s
What is a good NPV value?
A positive NPV indicates a profitable investment. The higher the NPV, the better.
Can NPV be negative?
Yes. A negative NPV means the investment may result in a net loss.
Is IRR better than NPV?
Both are useful. NPV gives a value; IRR gives a rate. Use both for deeper analysis.
Does Excel’s NPV include the initial investment?
No. You must add the initial investment separately to the result.
Conclusion
Knowing how to calculate NPV in Excel is crucial for financial analysts, business owners, and investors. It simplifies complex valuation and decision-making processes. With just a few formulas, you can evaluate investment feasibility and maximize your financial planning accuracy.