

Statistical testing is crucial for data analysis. Understanding the P-value is important. Excel makes it easy for students, researchers, and business analysts to compute P-values. You don’t need any fancy statistical software. In this guide, we’ll explain what a P-value is. We’ll also cover why it matters, where it’s used, and how to calculate it in Excel—step by step.
What Is the P-Value?
The P-value shows how significant the results are in a hypothesis test. It shows how likely we are to get a result that is as extreme or more extreme than what we observed, if the null hypothesis is true.
In simple terms: A low P-value (< 0.05) suggests strong evidence against the null hypothesis, while a high P-value (> 0.05) suggests weak evidence against it.
Why Do We Need the P-Value?
P-values help answer an important question in statistics: “Is this result significant, or just due to chance?” Without the P-value, we might misread data patterns. We could confuse random noise with real conclusions. It adds objectivity to decisions in data science, medicine, business, and research.
The P-value is a key tool in statistics. It helps us make smart choices using data. In hypothesis testing, the P-value shows how likely our results are due to random chance. Without the P-value, we would guess if our data supports or contradicts a theory.
How to Calculate P value in Excel | Perform P Value in Microsoft Excel | Hypothesis Testing
Where Do We Use the P-Value in Real Life?
P-values are used in nearly every field of study:
Medicine
Use Case: P-values help in clinical trials. They show if a new treatment or drug is better than an existing one or a placebo.
Example: A pharmaceutical company is testing a new vaccine for flu prevention. They divided the participants into two groups. One group gets the new vaccine, while the other group gets a placebo. After the trial, they analyze infection rates in both groups. If the P-value is less than 0.05, the company decides the vaccine cuts flu cases significantly. Then, it moves forward with development or approval.
Why it matters: Without the P-value, treatments might get approved by chance. This could result in harmful or ineffective solutions.
Marketing
Use Case: In digital marketing, P-values show if A/B test changes in a website, ad, or email campaign improve results.
Example: An e-commerce brand tests two versions of a product page: one with a video and one with an image. Version A (video) converts 6.5% of visitors into buyers, while Version B (image) converts 5.9%. Using Excel’s T.TEST function, they find a P-value of 0.03. This shows the conversion increase is statistically significant and not random.
Why it matters: Marketers use P-values to prevent false positives. This helps them confirm that changes really affect results when optimizing campaigns.
Finance
Use Case: Financial analysts use P-values in regression and time-series models. They check if market patterns or investment strategies are statistically significant.
Example: An investment firm analyzes whether a specific stock’s performance is related to interest rate changes. They run a regression analysis. The interest rate variable has a P-value of 0.01. This shows a statistically significant relationship. This helps shape their investment strategy. They adjust their holdings based on future interest rate forecasts.
Why it matters: P-values help analysts avoid noise and random trends. This leads to better investment decisions.
Manufacturing
Use Case: In quality control, manufacturers use P-values to assess whether variations in product quality are due to random variation or a specific defect in the process.
Example: A car manufacturer tests if a new machine part is producing defects at a higher rate than usual. Using a hypothesis test on defect rates, they get a P-value of 0.02, indicating a significant deviation. They halt production and investigate the issue before shipping poor-quality products.
Why it matters: P-values help keep manufacturing standards high. This cuts waste and protects brand reputation.
How to Calculate the P-Value in Excel?
You can find the P-value in Excel. Just use the built-in functions for your specific test. Let’s go through the T-Test example—a common method to compare two means.
Step 1: Enter Your Data
Input your sample data in two separate columns. For example, two groups: Group A and Group B.

Step 2: Use the T.TEST Function
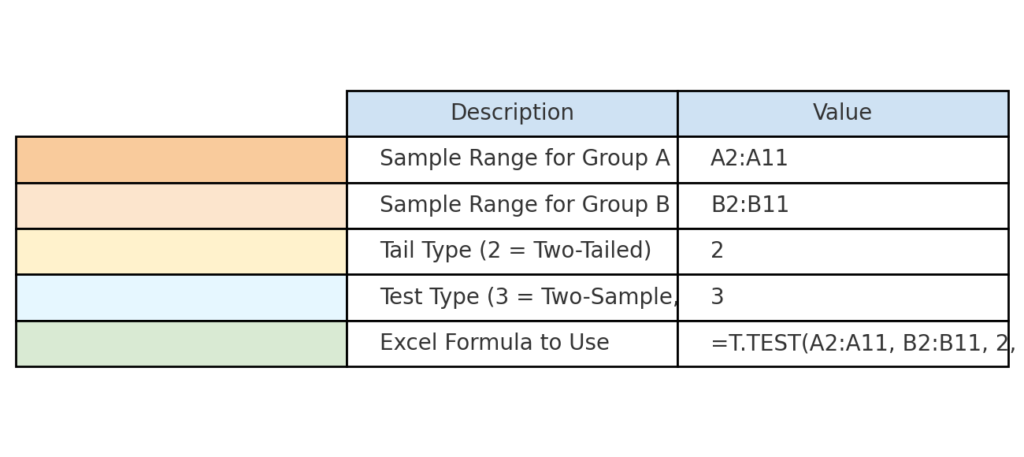
Apply the T.TEST formula to calculate the P-value:
=T.TEST(A2:A11, B2:B11, 2, 3)
Explanation:
- A2:A11 & B2:B11 are your sample ranges.
- 2 specifies a two-tailed test.
- 3 specifies a two-sample test assuming unequal variances (Welch’s test).
Step 3: Interpret the Result
If the result (P-value) is:
- < 0.05: Statistically significant. Reject the null hypothesis.
- ≥ 0.05: Not significant. Fail to reject the null.

FAQ’s
Can I calculate P-value from a Z-score in Excel?
Yes. Use the formula:
- =2*(1-NORM.S.DIST(ABS(z), TRUE))
What’s the difference between one-tailed and two-tailed P-values?
- One-tailed tests for direction (greater or less).
- Two-tailed tests for any significant difference, regardless of direction.
Is the P-value the same as confidence level?
No. A confidence level (e.g., 95%) relates to intervals. P-value helps test specific hypotheses.
Conclusion
Calculating the P-value in Excel is easier than most people think. You can run hypothesis tests fast and accurately with built-in functions like T.TEST and NORM.S.DIST. Plus, you can do it all right in your spreadsheet. Knowing about P-values is key for both scientific experiments and business tests. They help you make confident, evidence-based decisions.