

Making clear and consistent visuals in Excel is key. This is especially true for reports, dashboards, or financial insights. A helpful feature is copying a graph’s format. You can apply it to other charts. This saves time. No matter if you’re using line graphs, bar charts, or pie charts, this trick helps keep visuals clear and consistent for your audience. This guide shows you what graph formatting is, how to copy it in Excel, and its real-world benefits.
What is Graph Format in Excel?
Graph format refers to the visual styling and design elements of a chart in Excel. It includes:
- Chart type (e.g., column, pie, line)
- Colors and fills
- Font styles and sizes
- Axis formatting
- Gridlines
- Data labels
- Legend position
- Border and background effects
These formatting elements are key. They make your data easy to read, look good, and feel professional. Excel lets you copy a chart’s formatting and use it on other graphs. This saves time and keeps your brand consistent.

How to Copy Graph Format in Excel?
You can copy the formatting of one graph to another using two easy methods:
Method 1: Use “Paste Special”
- Click the chart whose format you want to copy.
- Press Ctrl + C to copy it.
- Click the target chart you want to format.
- Go to the Home tab → Click the Paste drop-down arrow → Choose Paste Special.
- Select Formats → Click OK.
This method copies styles without replacing the actual data of the target chart.

Method 2: Use Format Painter
- Click the source chart.
- Go to the Home tab → Click Format Painter (paintbrush icon).
- Then click on the destination chart.
Note: This method might not work well if you switch between very different chart types, like pie to line.

Examples
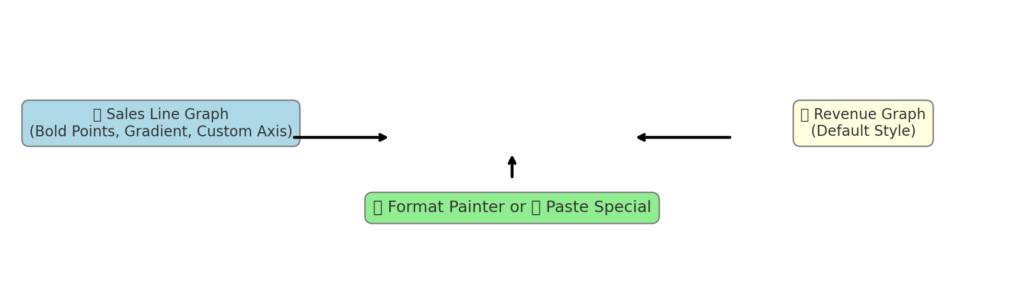
Example 1: Copying Style from Sales Line Graph to Revenue Graph
- Original chart: Line graph with bold data points, gradient background, and custom axis.
- New chart: Default style.
- Action: Use Format Painter or Paste Special → Instantly match design without reapplying styles.
Example 2: Copying Corporate Theme to All Graphs
- Use a master graph with brand colors and fonts.
- Copy this format to all new charts in a report.
- Ensure consistency in financial decks and client presentations.

Benefits of Copying Graph Format in Excel
Ensures Visual Consistency
A consistent style in all charts boosts professionalism and readability. This is important for presentations and published reports. It helps avoid viewer confusion. This way, the focus stays on the data, not on design differences.
Saves Significant Time
Manually formatting multiple charts can take hours. Copying formats in just a few clicks makes work easier. This is great for large reports or dashboards.
Enhances Data Storytelling
Good formatting highlights trends and insights more clearly. Consistent styles guide the viewer’s eye to the right place. This is key in data storytelling.
Minimizes Human Error
Manually applying formatting may lead to inconsistencies or missed elements (like mislabeled axes). Copying formatting eliminates these issues with template-like reliability.
Supports Brand Identity
For businesses, using corporate colors and fonts across graphs reinforces brand guidelines. This is especially helpful in client-facing reports or investor updates.
Works Well in Automated Reports
You can apply formatting from one chart to other charts in Excel. This is great for creating dynamic or template-driven reports, like monthly or quarterly ones.
FAQ’s on Copying Graph Format in Excel
Does copying the format also copy the data?
No. Only the visual style is copied. Your original data in the target chart stays the same.
Can I copy formatting between different chart types?
You can try, but results may vary. Copying from one line chart to another works well. But copying from a pie chart to a column chart may lead to layout inconsistencies.
Will copying format overwrite my chart layout?
Only the design aspects change. The data series, labels, and chart type stay the same unless you change them yourself.
Can I save a graph format as a template?
Yes! Right-click the chart you formatted. Choose “Save As Template.” Then, apply this template to other charts by selecting “Change Chart Type” and then “Templates.”
How to Copy Chart/Graph Format in Excel
Conclusion
Learning to copy graph formats in Excel can transform any user’s ability to create polished, consistent, and brand-aligned reports. No matter if you’re a marketer sharing campaign insights, a financial analyst creating quarterly summaries, or a student handing in a research paper, good formatting helps with clarity and credibility. Excel helps users create impressive visuals quickly with tools like Paste Special, Format Painter, and Chart Templates. Use this skill to streamline your reporting process and ensure your work always looks professional.