

Microsoft Excel is a top tool for organizing, analyzing, and reporting data. Whether you’re a student, data analyst, accountant, or small business owner, knowing how to count rows in Excel can save time and improve your decisions. This guide covers all you need to know. It explains what rows are and how to count them. You’ll find different methods and practical examples. Getting these concepts isn’t only about knowing Excel. It’s about making your daily work more accurate and efficient.
What Are Rows in Excel?
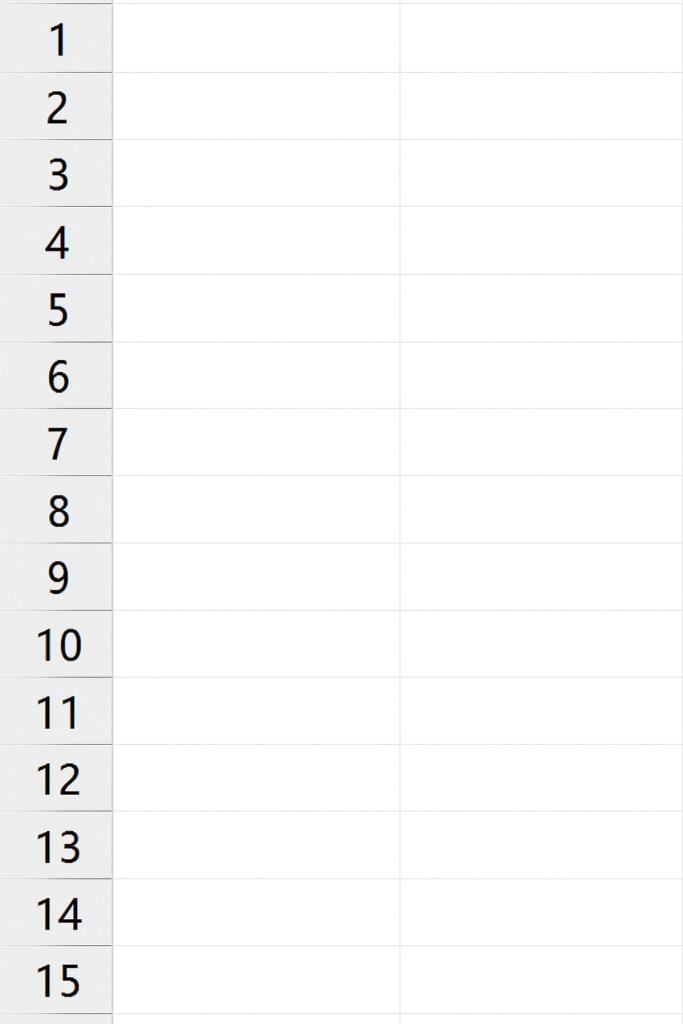
In Excel, a row is a horizontal line of cells labeled with numbers along the left-hand side of a worksheet. Each row runs from left to right and can contain data such as text, numbers, formulas, or dates. The row number (e.g., 1, 2, 3…) shows where data is located and is key to Excel’s grid system, which mixes rows and columns.
For example:
- Row 1 typically contains headers like “Product Name”, “Price”, or “Quantity”.
- Row 2 and onward may contain the actual data entries related to those headers.
In Excel 365 or Excel 2021, a worksheet can hold up to 1,048,576 rows. This makes it great for storing big datasets.
How to Count Rows in Excel
Here are all the best methods:
Count All Rows (Including Blank)
To count all rows in a worksheet:
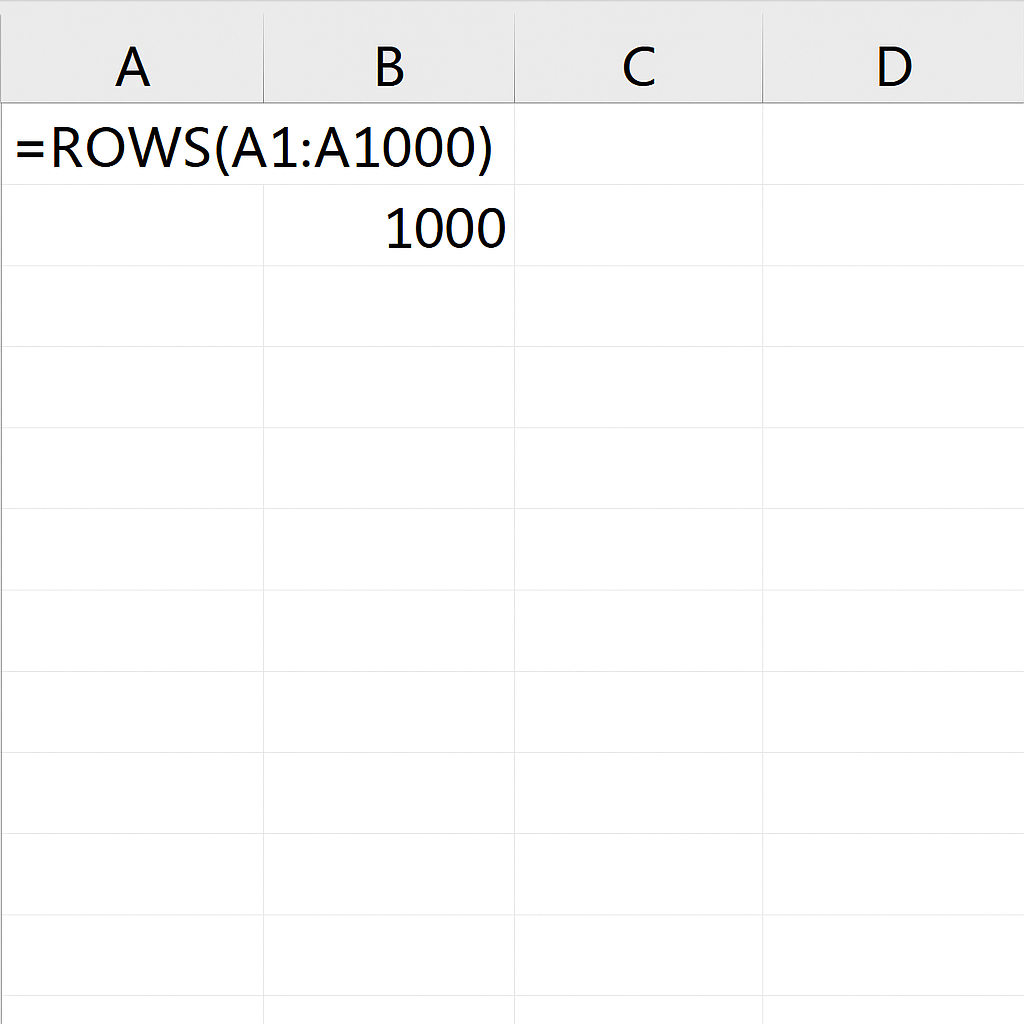
=ROWS(A1:A1000)
This formula counts the number of rows in a specific range. For example, ROWS(A1:A1000) returns 1000. It doesn’t check for content—just how many rows are in the range.
Count Non-Empty Rows
To count only rows that contain at least one non-empty cell, use:
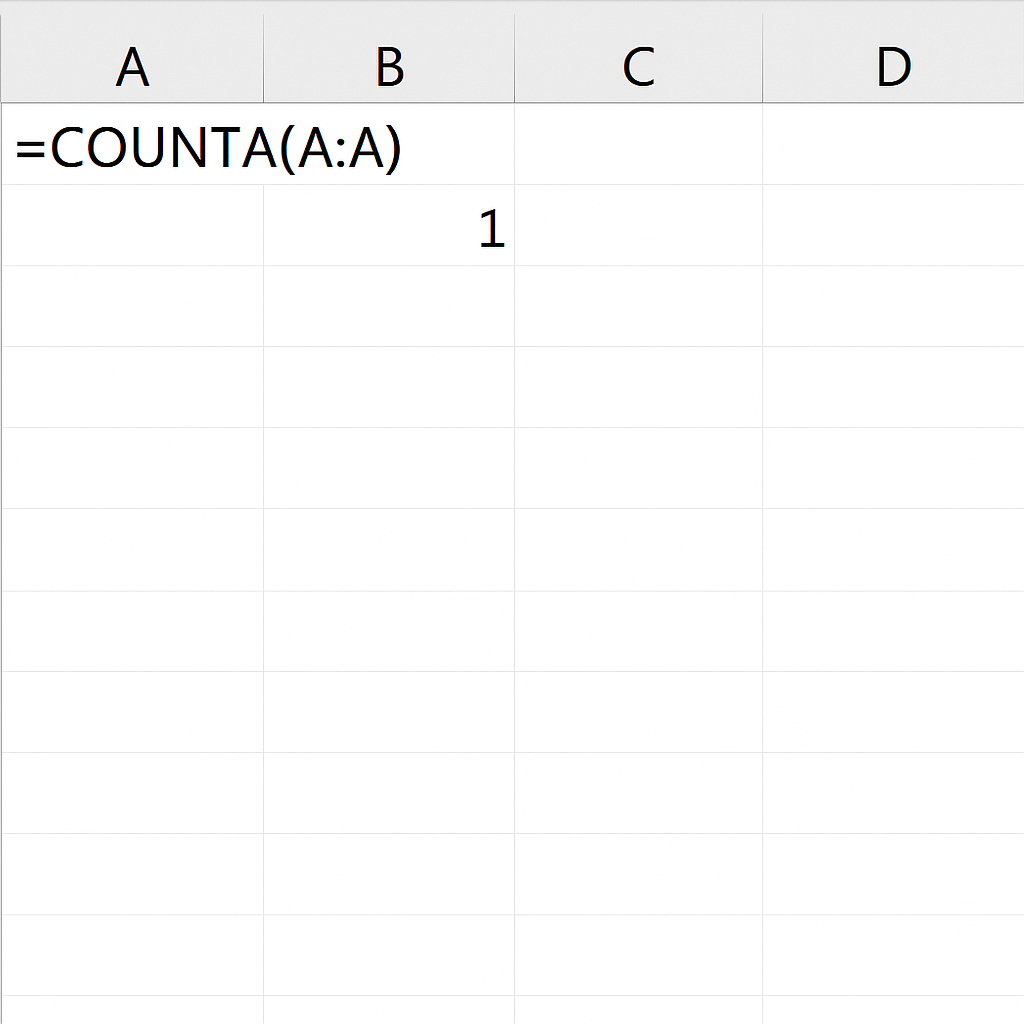
=COUNTA(A:A)
This formula counts non-blank cells in column A. If you have more columns, you can use an IF or FILTER function.
Count Non-Blank Rows Using Array Formula
When you want to count rows where any column in a row contains data:
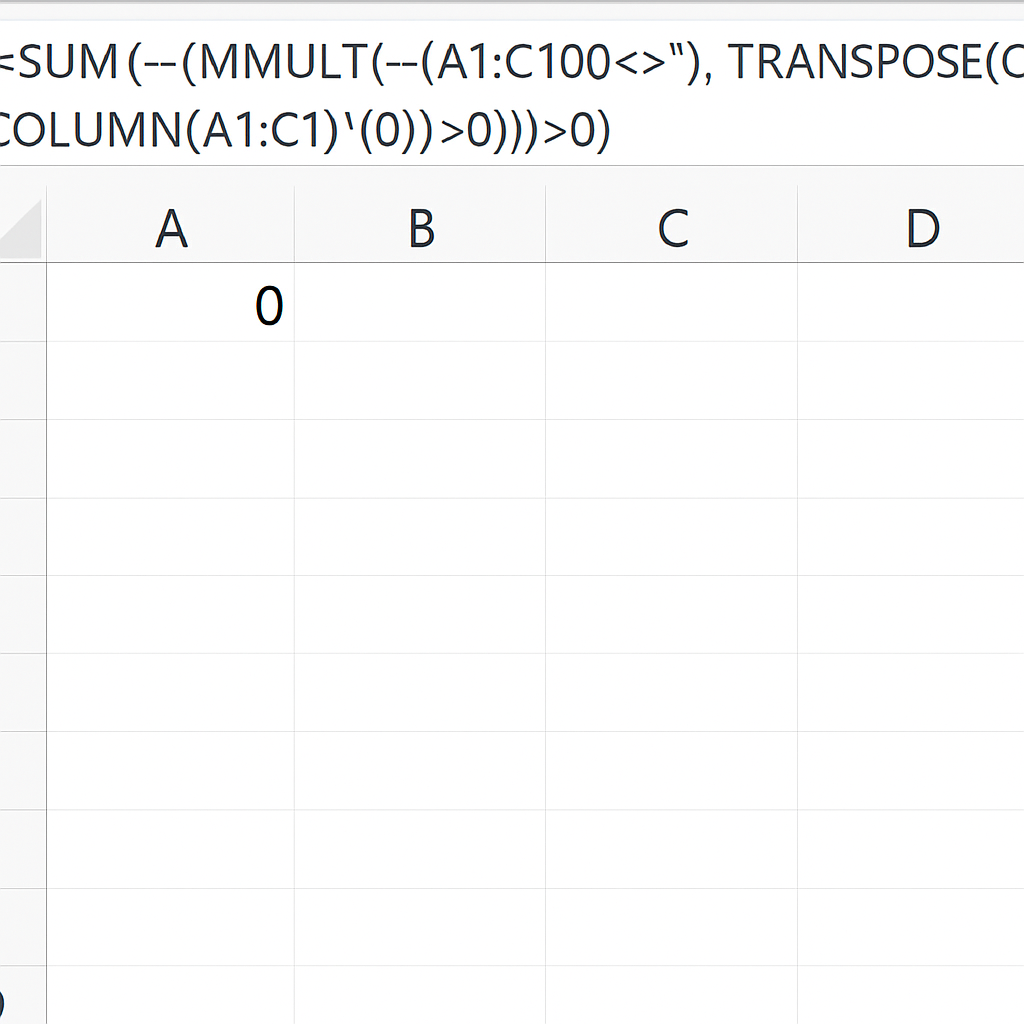
=SUM(–(MMULT(–(A1:C100<>””) , TRANSPOSE(COLUMN(A1:C1)^0))>0))
This advanced formula checks if any of the columns A to C in each row has data, and sums the rows that are not empty.
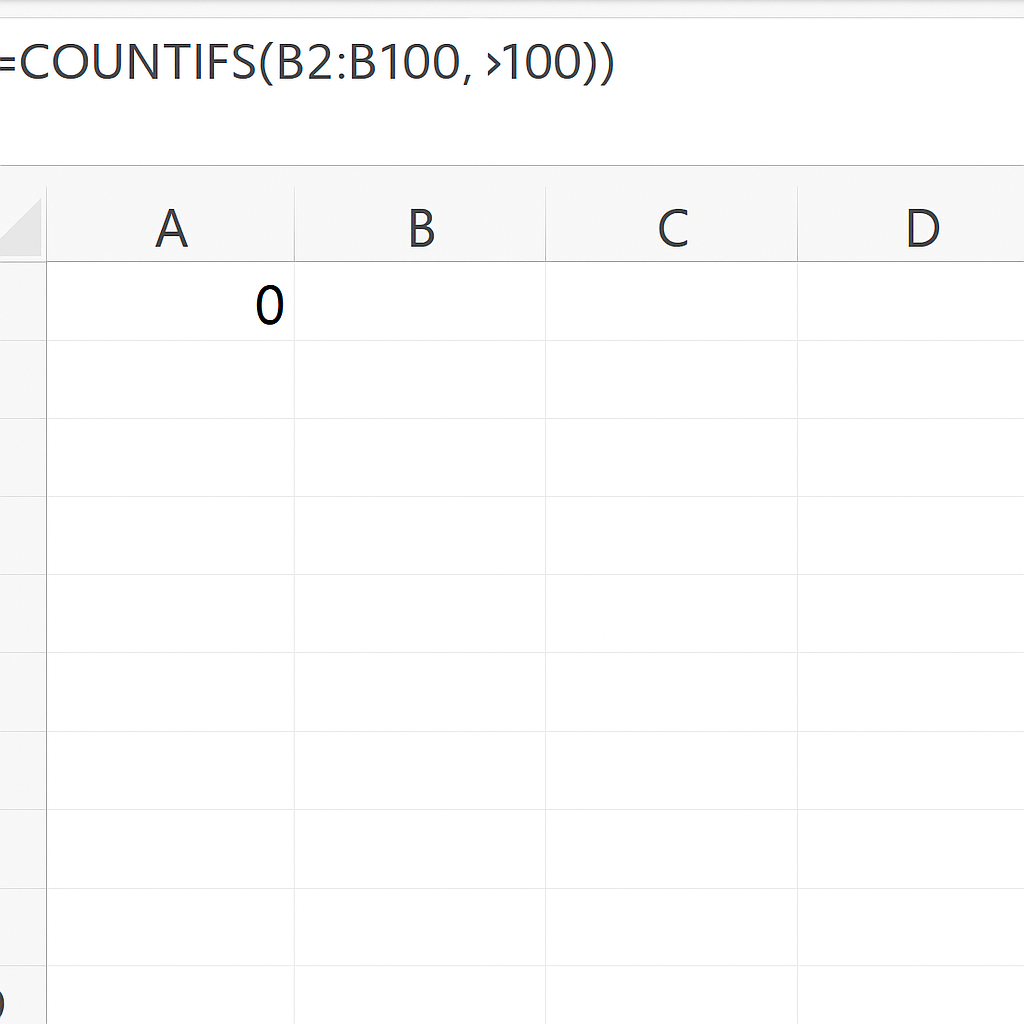
Count Rows Based on Criteria (Using COUNTIFS)
To count rows that match a condition:
=COUNTIFS(B2:B100, “>100”)
This example counts rows where the values in column B are greater than 100. You can add more criteria by adding more ranges and conditions.
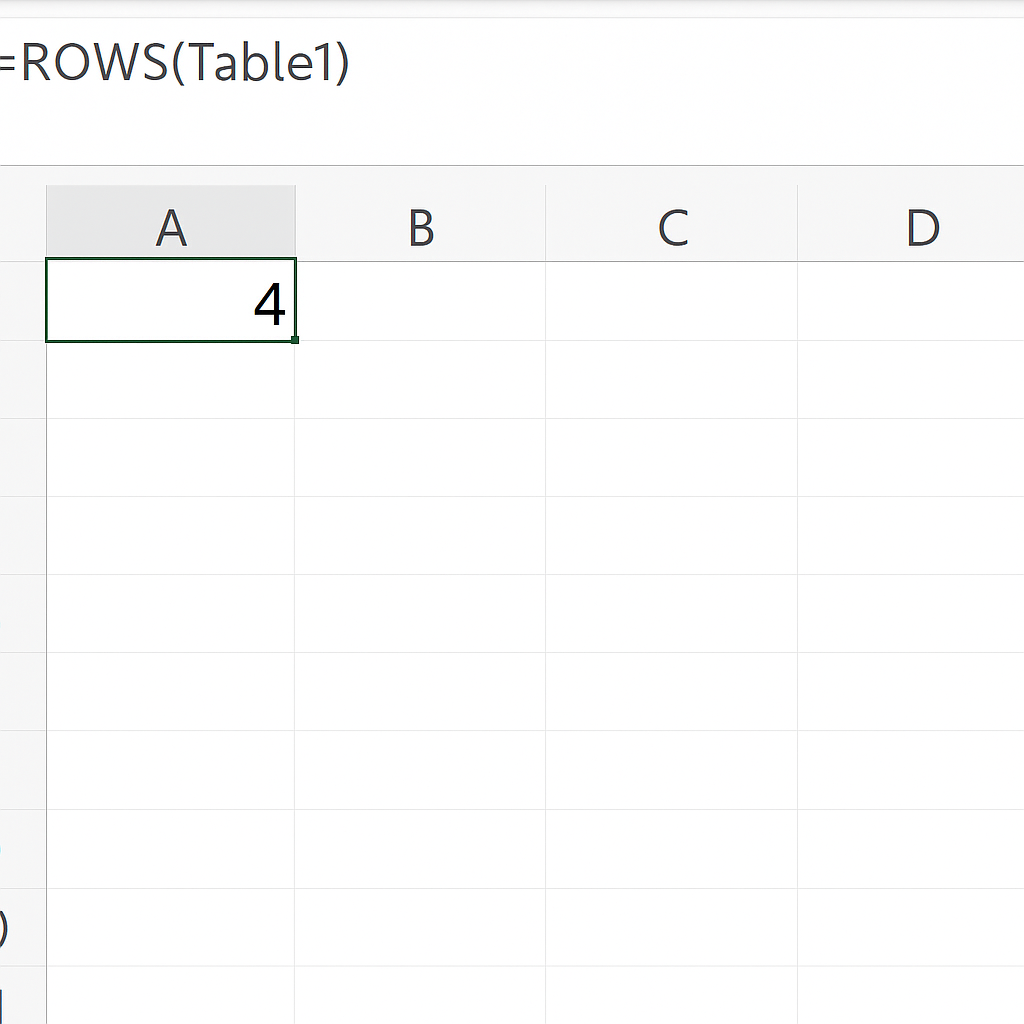
Use Table Tools for Row Counting
If your data is in an Excel Table (Insert > Table), you can easily count rows by referencing the table.
=ROWS(Table1)
Tables grow and change automatically when you add more data. This makes them a dependable choice for dynamic datasets.
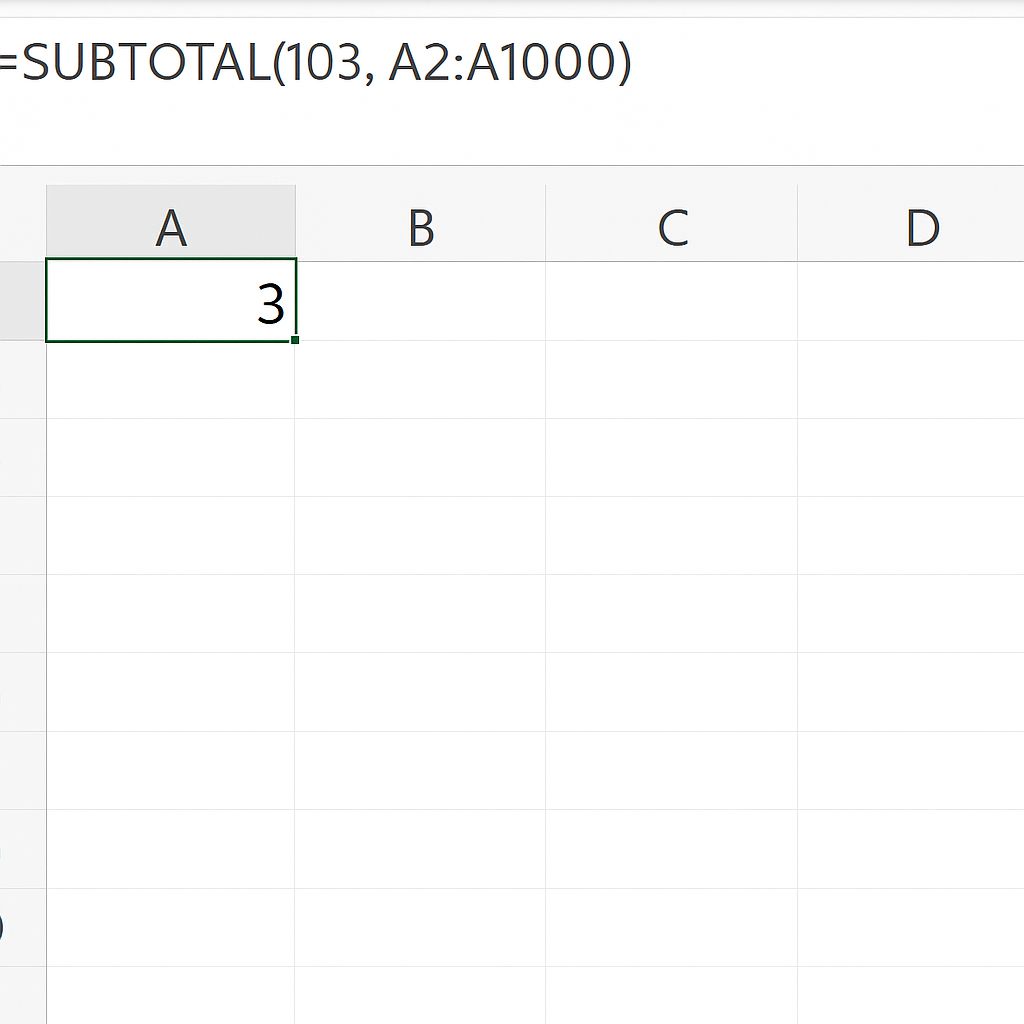
Using Filters to Count Visible Rows
If you’re working with filtered data:
=SUBTOTAL(103, A2:A1000)
Function code 103 counts non-empty, visible cells only—perfect for filtered data views.
Practical Examples
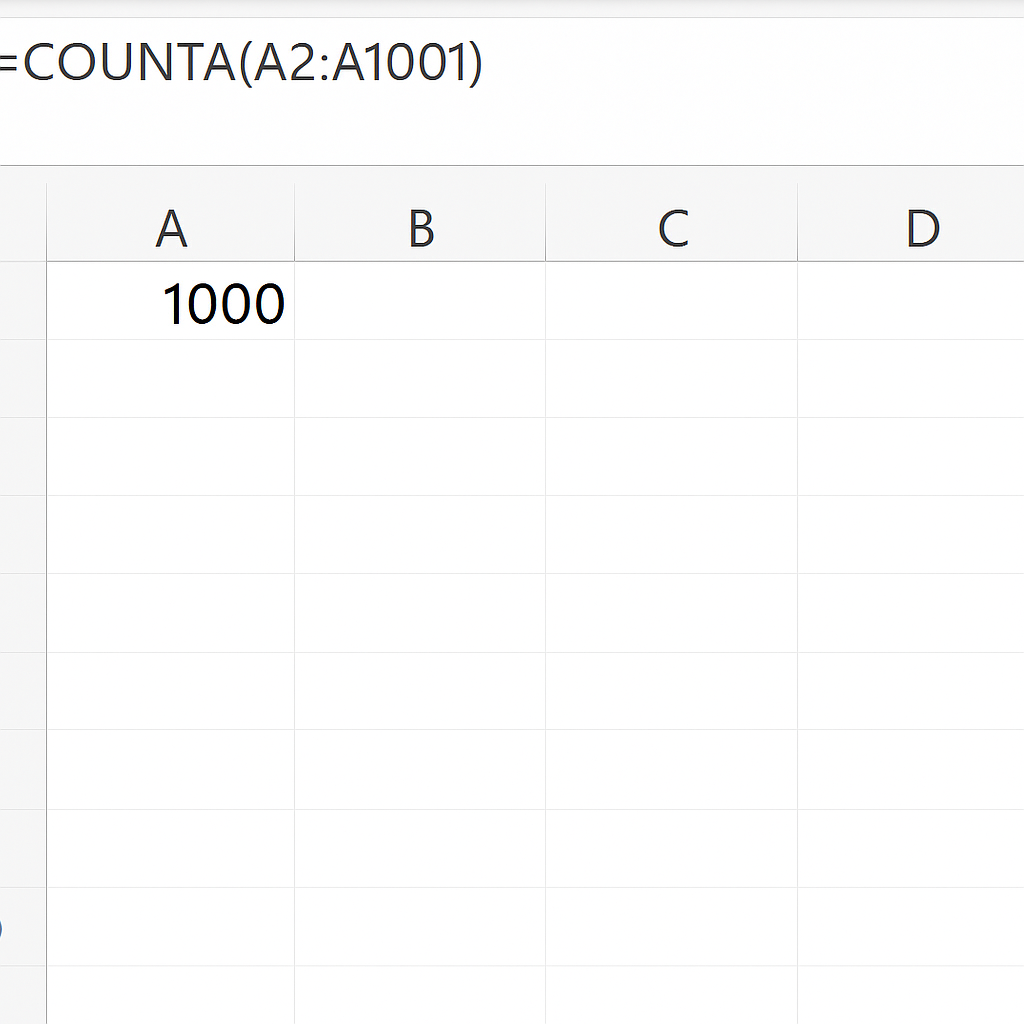
Example 1: Count All Sales Transactions
If you manage a sales log in column A from A2 to A1001:
=COUNTA(A2:A1001)
This tells you how many sales entries are recorded, excluding the header.
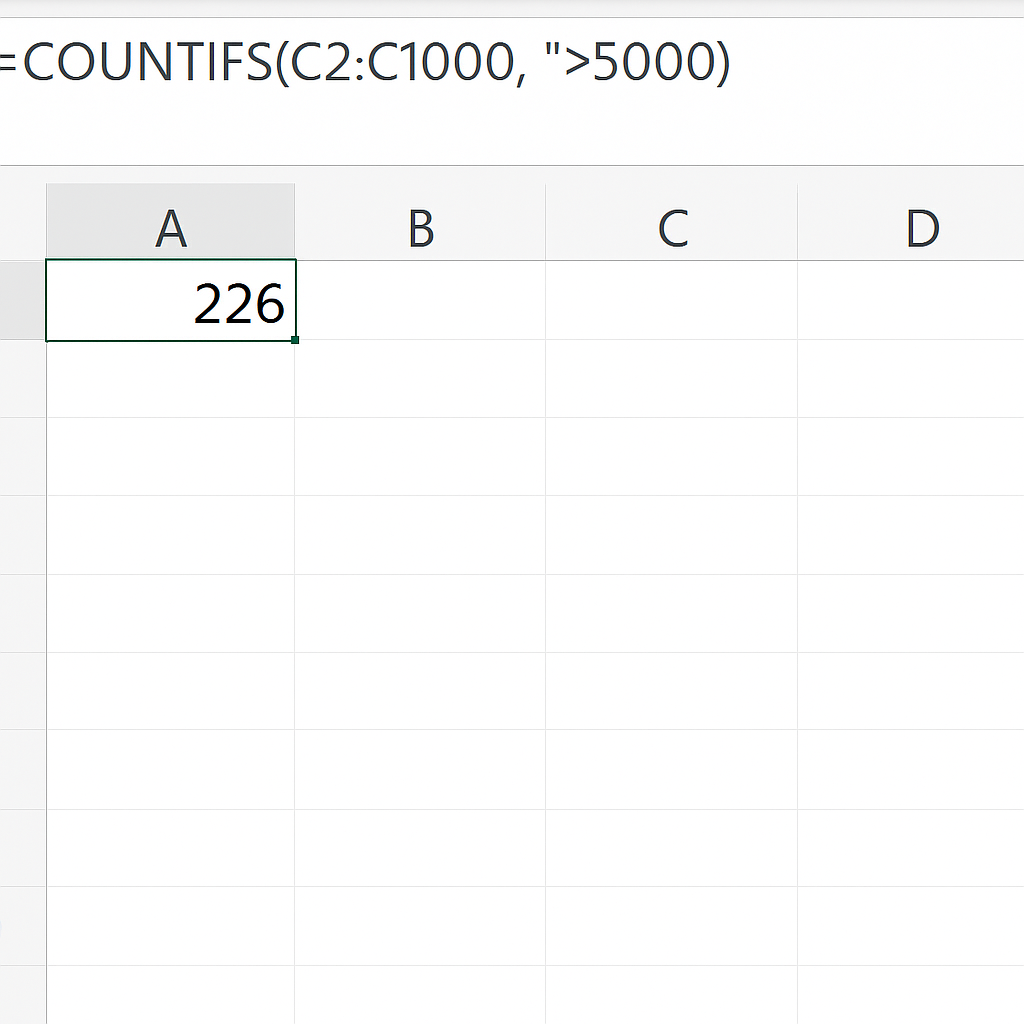
Example 2: Count Rows Where Revenue Exceeds $5000
Assuming revenue is in column C:
=COUNTIFS(C2:C1000, “>5000”)
This helps filter high-value transactions, useful for sales performance reporting.
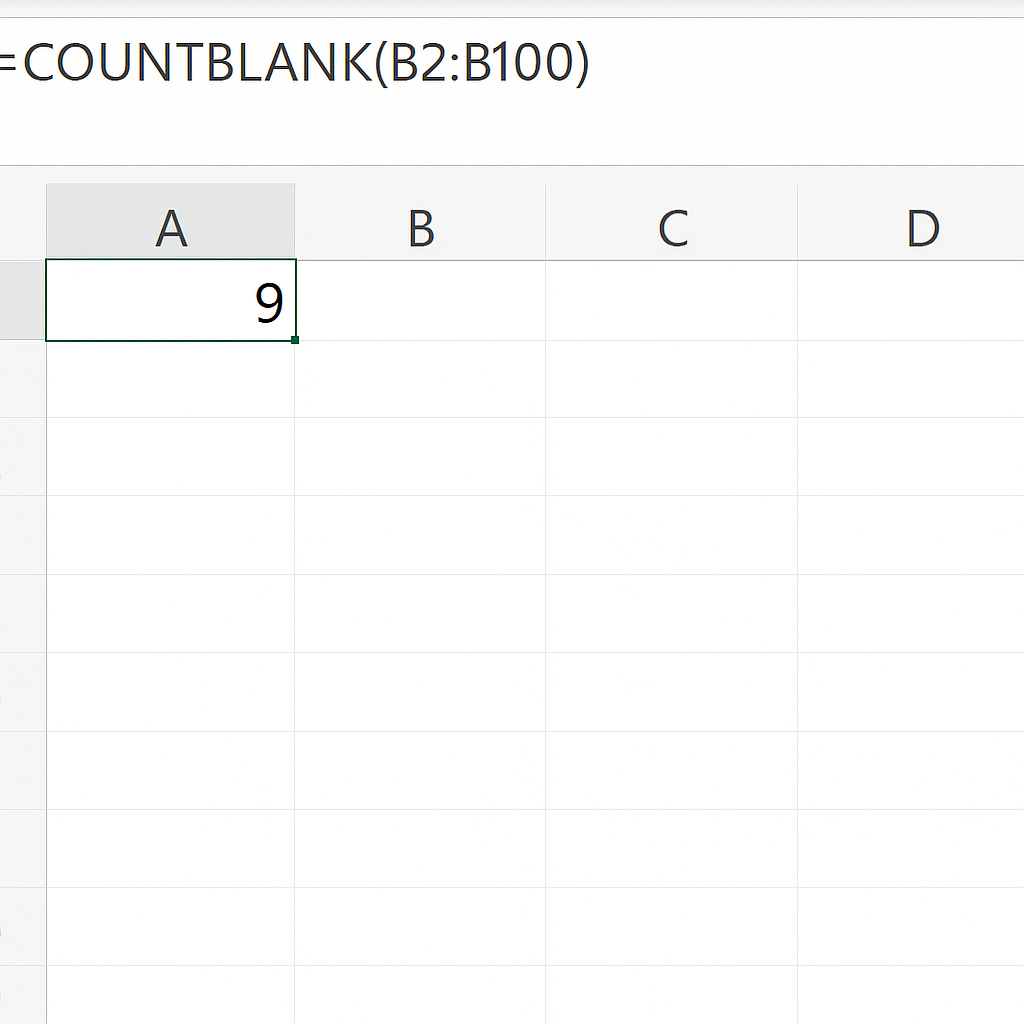
Example 3: Count Rows with Missing Information
To find rows with blanks in column B (e.g., missing email):
=COUNTBLANK(B2:B100)
This helps spot incomplete records, ensuring data quality before analysis or import.
Benefits of Knowing How to Count Rows in Excel
Accurate Data Reporting
Counting rows well means your reports show real data, not just empty entries. This improves the credibility of your results and helps make accurate business decisions.
Saves Time in Large Datasets
Counting rows manually or using inefficient methods is time-consuming. Automated formulas help you handle bigger files and scale your data tasks with ease.
Enables Conditional Analysis
You can combine row counts with conditions, like COUNTIFS. This helps you quickly see performance, track KPIs, and check compliance. Conditional row counts provide valuable insights, whether it’s for sales over a threshold or finding missing data.
Better Data Validation
Knowing how to count rows helps with auditing. You can quickly check if all needed records are there. This is especially helpful for financial or legal spreadsheets.
Helps in Data Cleaning Tasks
Before running calculations or visualizing data, you need to clean it. Counting rows with missing or invalid data is often step one in cleanup routines. It forms the backbone of reliable analytics.
Excel: How to Count the Number of Rows in a Table
FAQ’s
What is the difference between COUNT, COUNTA, and COUNTIFS?
- COUNT only counts numeric values.
- COUNTA counts all non-empty cells (text or numbers).
- COUNTIFS counts only the cells that meet one or more conditions. It’s ideal when you want filtered counts.
How do I count rows only if a specific column is not blank?
You can use:
=COUNTIF(B2:B1000, “<>”)
This formula counts only those rows where column B is not empty.
How can I count filtered rows only?
Use the SUBTOTAL function with code 103:
=SUBTOTAL(103, A2:A1000)
It counts visible, non-hidden, non-empty rows. This is helpful in reports with filters.
Is it possible to count distinct rows in Excel?
Yes. You can use the UNIQUE function (available in Excel 365) combined with COUNTA:
=COUNTA(UNIQUE(A2:A1000))
This counts the distinct values in column A. It helps to avoid duplicates in the analysis.
Conclusion
Learning how to count rows in Excel is an essential skill for anyone working with data. It’s not just about knowing a few formulas—it’s about choosing the right method for the right situation. Excel offers many ways to get your tasks done fast and accurately. You can count non-empty rows, apply filters, check for missing data, or analyze rows by conditions.