

Microsoft Excel is a go-to tool for organizing, analyzing, and interpreting data. A key task in data analysis is finding unique values. These are entries that show up only once or are distinct in a dataset. Counting unique values in Excel is key for clear data and accurate reports. This applies to customer names, product SKUs, and email addresses. In this guide, you’ll learn to count unique values in Excel. We’ll use formulas, built-in functions, and real-life examples.
What Are Unique Values?
Unique values in Excel refer to entries in a dataset that are either:
- Truly unique (appear only once), or
- Distinct (each different value, regardless of repetition)
For example:
| A (Names) |
| John |
| Sarah |
| John |
| Mike |
| Sarah |
| Emma |
- Truly unique values = Mike, Emma (appear only once)
- Distinct values = John, Sarah, Mike, Emma (all different names)
Excel lets you count values based on your goals. You can count distinct values or just those that occur once. It offers different functions for each option.

How to Count Unique Values in Excel?
Here are the most effective methods to count unique values in Excel:
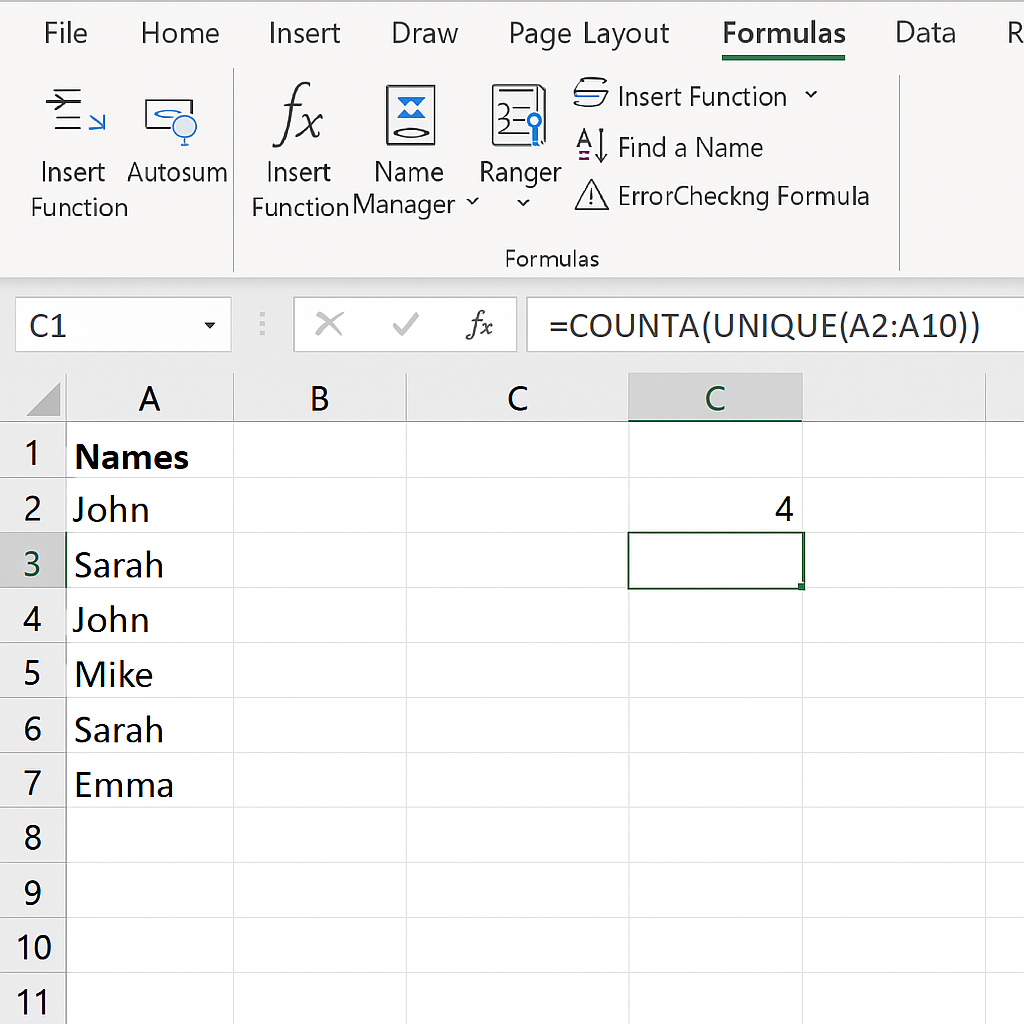
Method 1: Using the UNIQUE and COUNTA Functions (Excel 365 / Excel 2019+)
Best for: Counting distinct values in a column
Formula:
=COUNTA(UNIQUE(A2:A10))
- UNIQUE() returns the distinct values from the range.
- COUNTA() counts how many unique values were returned.
This method only works in Excel 365 and Excel 2019 or later.
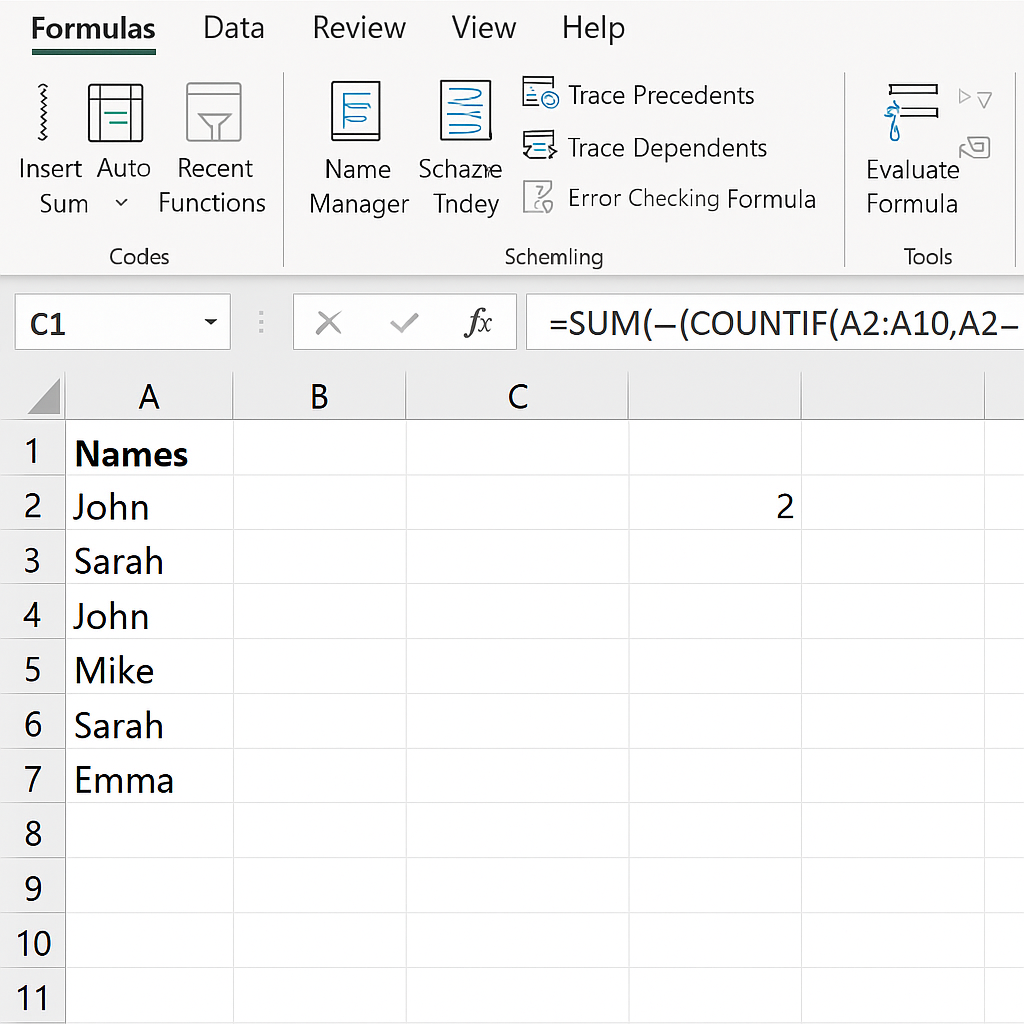
Method 2: Count Values That Appear Only Once (Truly Unique)
Formula:
=SUM(–(COUNTIF(A2:A10, A2:A10)=1))
Use Ctrl + Shift + Enter if you’re not using Excel 365.
- This formula counts values that appear only once in the selected range.
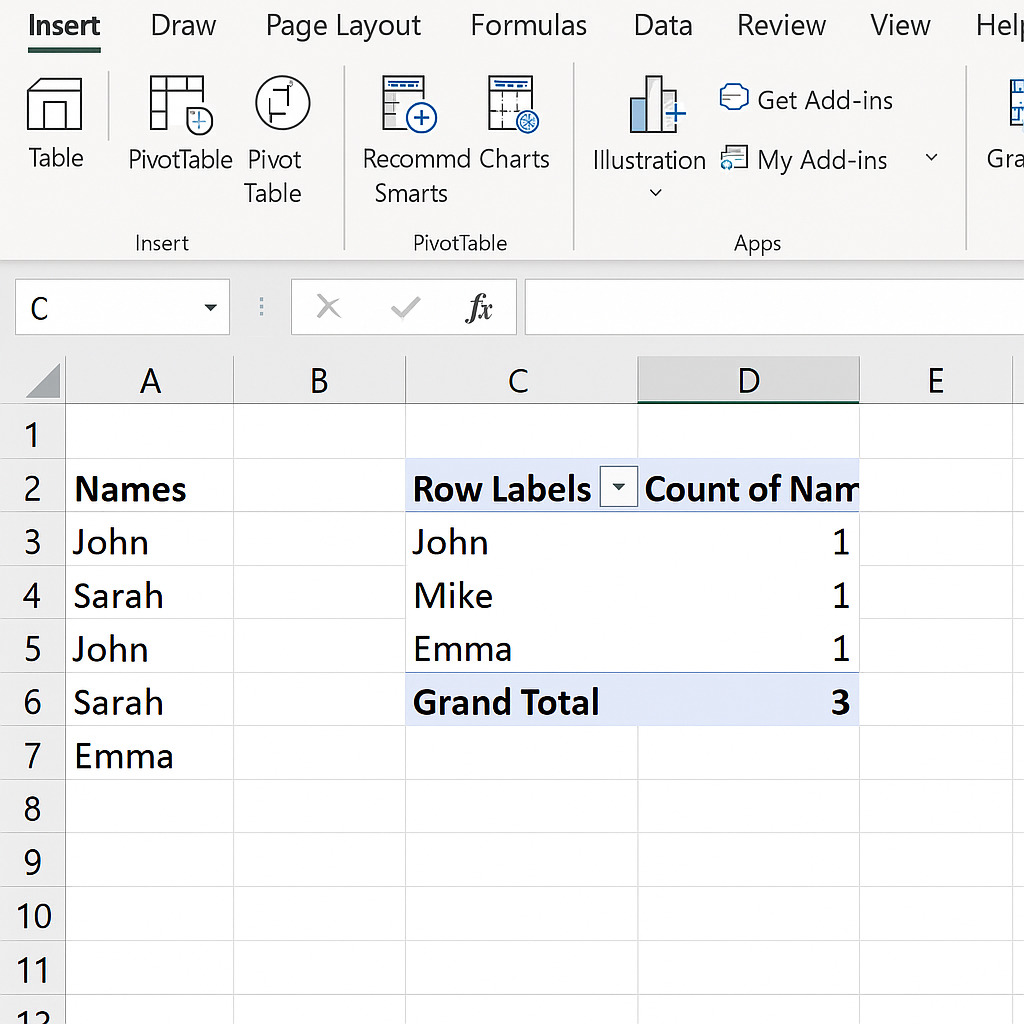
Method 3: Using Pivot Tables (All Excel Versions)
Steps:
- Select your dataset and insert a Pivot Table.
- Drag the column you want to analyze into the Rows area.
- Drag the same column into the Values area.
- Set the value field to Count.
- Filter for values with count = 1 (to get only truly unique values).
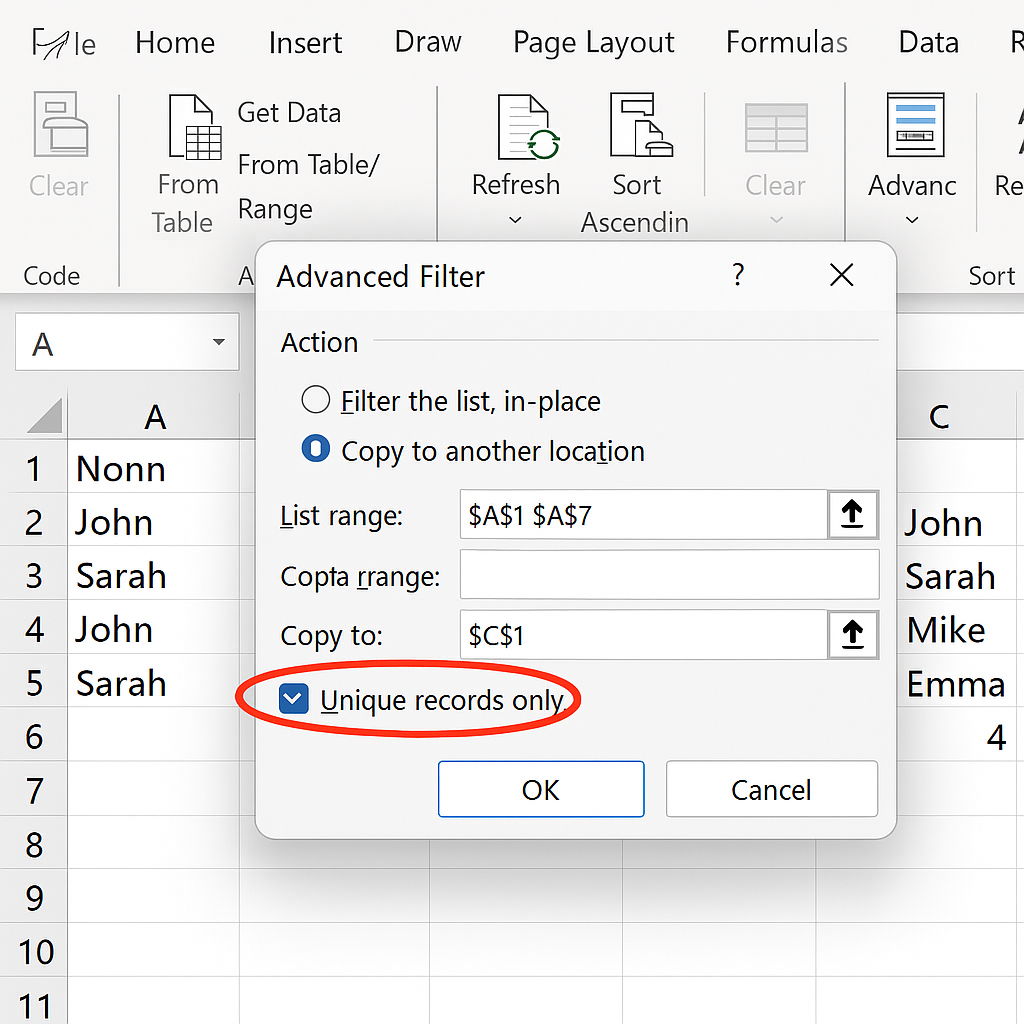
Method 4: Use Advanced Filter to Extract Unique Values
Steps:
- Go to Data > Advanced Filter.
- Choose “Copy to another location”.
- Check the box for Unique records only.
- Specify a copy range and click OK.
- Use COUNTA() to count the number of extracted entries.
Examples
Example 1: Count Distinct Products Sold
| A (Product ID) |
| P1001 |
| P1002 |
| P1001 |
| P1003 |
| P1002 |
Formula: =COUNTA(UNIQUE(A2:A6)) Result: 3 (P1001, P1002, P1003)
Example 2: Count Truly Unique Emails
| A (Email) |
| john@email.com |
| sarah@email.com |
| john@email.com |
| emma@email.com |
Formula: =SUM(–(COUNTIF(A2:A5, A2:A5)=1)) Result: 2 (sarah@email.com, emma@email.com)
Benefits of Counting Unique Values in Excel
Improves Data Accuracy
Identifying unique entries helps you avoid duplicate records in reports. This ensures accurate analysis and better decision-making.
Enables Smarter Reporting
It’s important to know how many distinct customers, orders, or SKUs you have. This information is crucial for KPIs, dashboards, and forecasting models.
Supports Data Cleanup
Finding values that appear only once is helpful. This process can remove outliers or fix errors, especially in email lists, invoices, or survey responses.
Enhances Filtering and Sorting
Once you find unique values, you can use them for categorization, segmentation, or validation. This will improve your workbook’s structure.
Saves Time in Manual Checking
Excel formulas and features automate tedious manual tasks, especially with large datasets.
Frequently Asked Questions (FAQ’s)
What’s the difference between distinct and unique values?
- Distinct values: All different entries, even if repeated.
- Unique values: Entries that appear only once.
Does the UNIQUE function work in all Excel versions?
No. The UNIQUE() function is available only in Excel 365 and Excel 2019 or newer.
How do I count unique values across multiple columns?
Use:
=COUNTA(UNIQUE(FILTER(A2:B10, A2:A10<>””)))
This works in Excel 365. For earlier versions, use helper columns or Power Query.
Can I count unique values using Power Query?
Yes. Power Query can remove duplicates and count rows. This gives you a scalable and automated way to handle large datasets.
Can I use conditional formatting to highlight unique values?
Yes. Use a formula like =COUNTIF($A$2:$A$100, A2)=1 in conditional formatting to highlight values that appear only once.
Conclusion
Counting unique values in Excel is key for accurate data analysis, reporting, and database management. You can use formulas, Pivot Tables, or Excel’s built-in functions. These methods help you quickly find and count distinct and truly unique entries.