

No matter if you’re a student, data analyst, accountant, or business owner, knowing how to calculate the range in Excel is key for analyzing data. Excel is a strong tool for numerical analysis. Calculating the range shows the spread between your highest and lowest values. This is a key metric in many data reports. In this article, we’ll walk you through what “range” means in Excel, how to calculate it using formulas, real-life examples, and why it matters.
What is Range?
In math and data analysis, range means the difference between the highest and lowest numbers in a set.
Formula:
Range = Maximum Value – Minimum Value
It gives a quick sense of how spread out the values are. For example:
- In the list: 5, 10, 15, 20 → Range = 20 – 5 = 15
- If all values are the same, the range is zero.
In Excel, we use built-in functions like MAX() and MIN() to calculate the range efficiently.
How to Find Range on Excel
To find the range in Excel, use this simple formula: subtract the minimum value from the maximum value. Below are various ways to calculate the range.
Method 1: Use MAX and MIN Functions
This is the most direct way to calculate range in Excel.
Formula:
=MAX(range) – MIN(range)
Example:
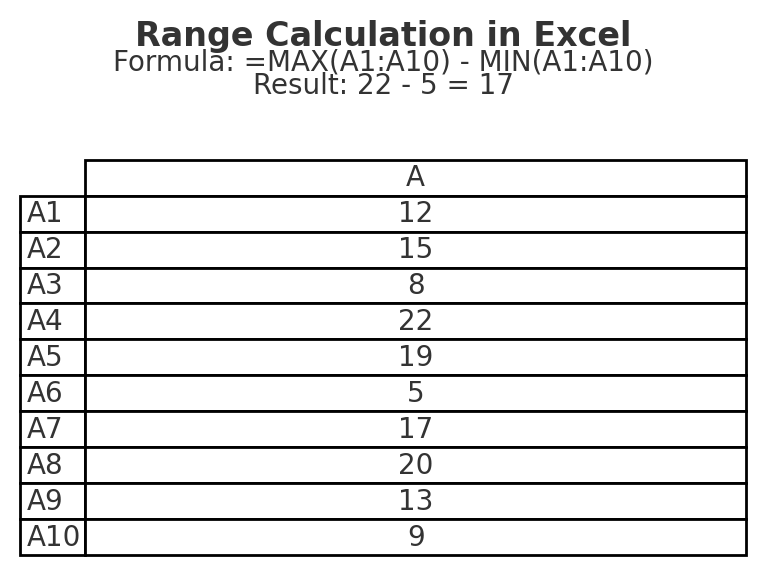
If your data is in cells A1 to A10:
=MAX(A1:A10) – MIN(A1:A10)
Excel will show the difference between the highest and lowest numbers in that range.
Method 2: Use Named Ranges (For Clarity)
You can assign a name to a range for easier reference.
Steps:
- Select your data (e.g., A2:A20).
- Go to Formulas > Define Name.
- Name it something like SalesData.
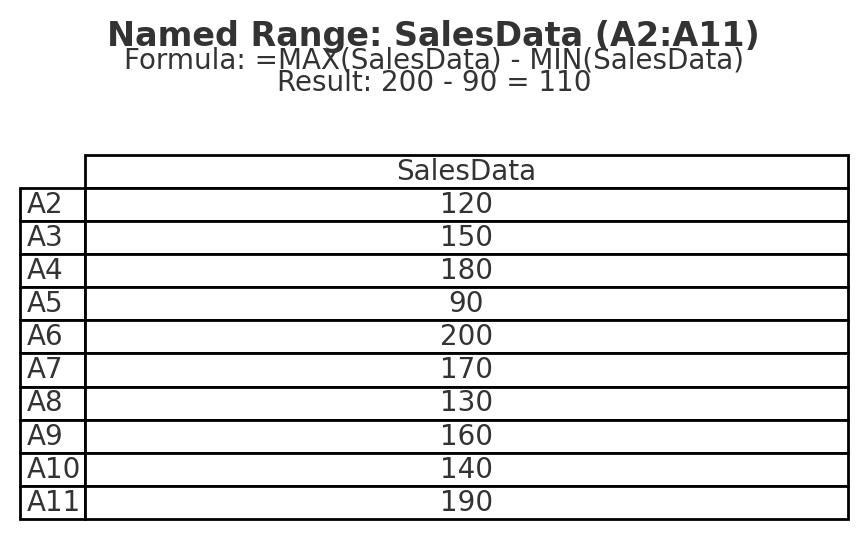
- Now use:
=MAX(SalesData) – MIN(SalesData)
This makes formulas easier to understand, especially in large spreadsheets.
Method 3: Use Helper Cells
To show the maximum and minimum values first, do this before finding the range:
Setup:
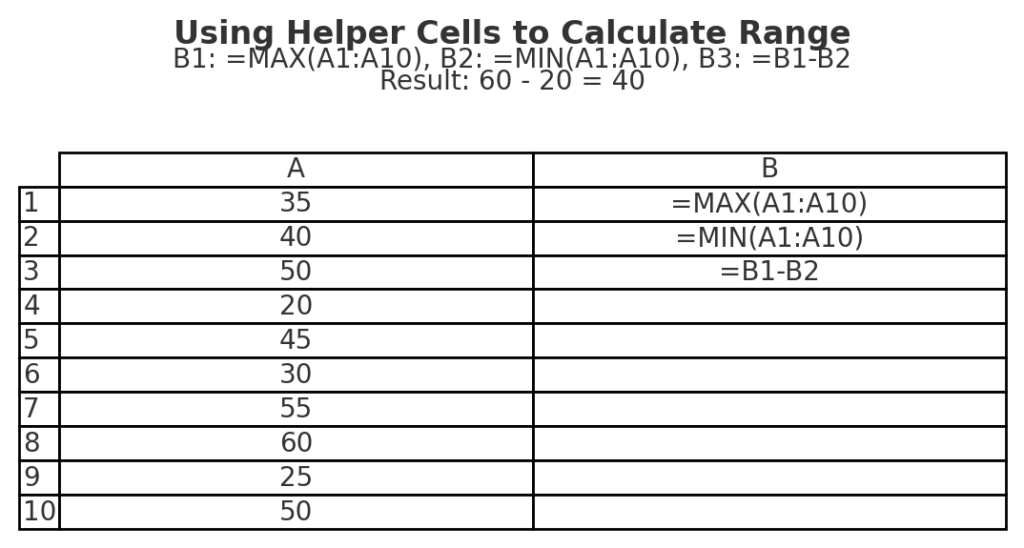
- In cell B1: =MAX(A1:A10)
- In cell B2: =MIN(A1:A10)
- In cell B3: =B1 – B2
This setup is ideal when creating dashboards or visual summaries.
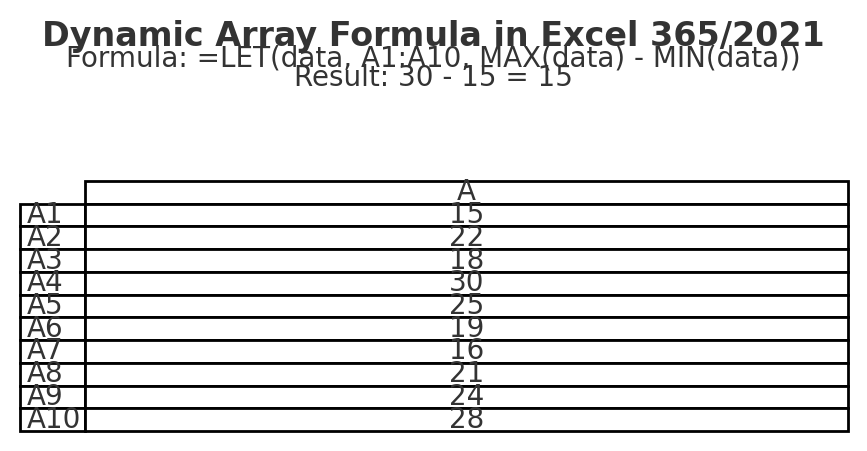
Method 4: Use an Array Formula (For Dynamic Analysis)
With Excel 365 or 2021, use dynamic arrays for more flexible range calculations.
Example:
=LET( data, A1:A10, MAX(data) – MIN(data) )
This makes the formula readable and dynamic.
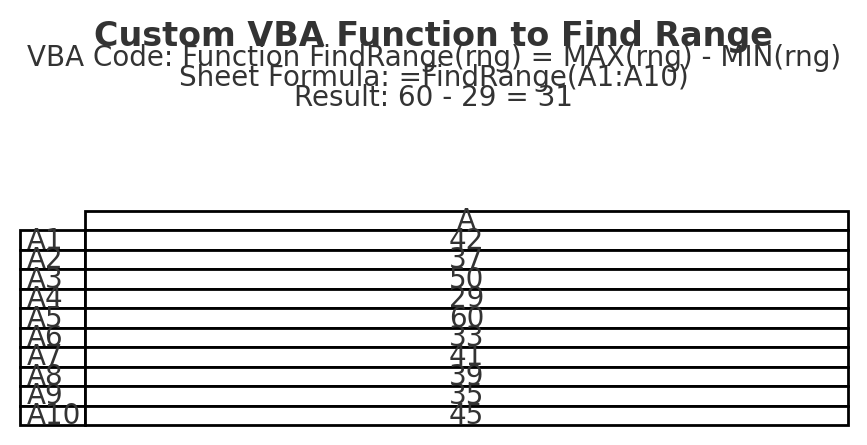
Method 5: Use VBA to Create a Custom Range Function (Advanced)
For repetitive tasks or custom reports, you can create your own range function using VBA.
Sample Code:
Function FindRange(rng As Range) As Double FindRange = Application.WorksheetFunction.Max(rng) – Application.WorksheetFunction.Min(rng) End Function
Now in your sheet, use:
=FindRange(A1:A10)
Useful when you want to reuse the same logic in multiple workbooks.
Examples of Finding Range in Excel
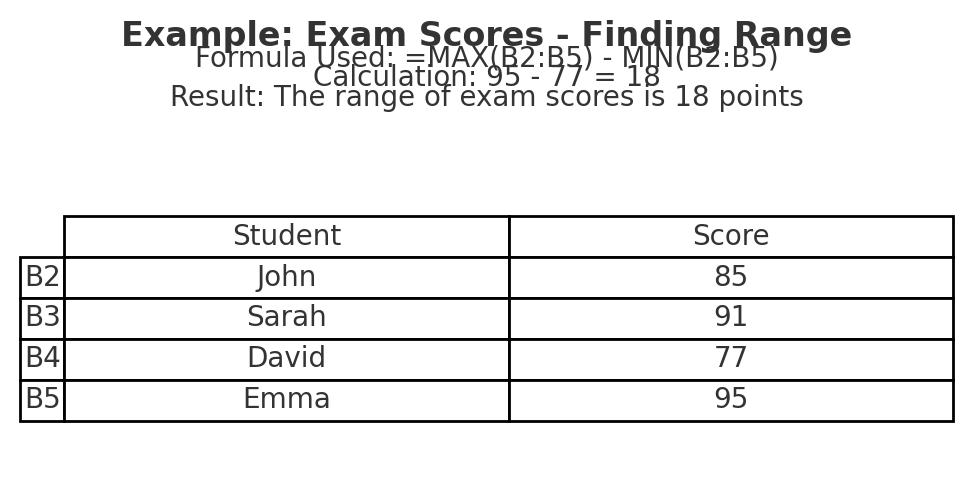
Example 1: Exam Scores
| Student | Score |
| John | 85 |
| Sarah | 91 |
| David | 77 |
| Emma | 95 |
Formula:
=MAX(B2:B5)-MIN(B2:B5)
Output:
95 – 77 = 18 → The range of exam scores is 18 points.
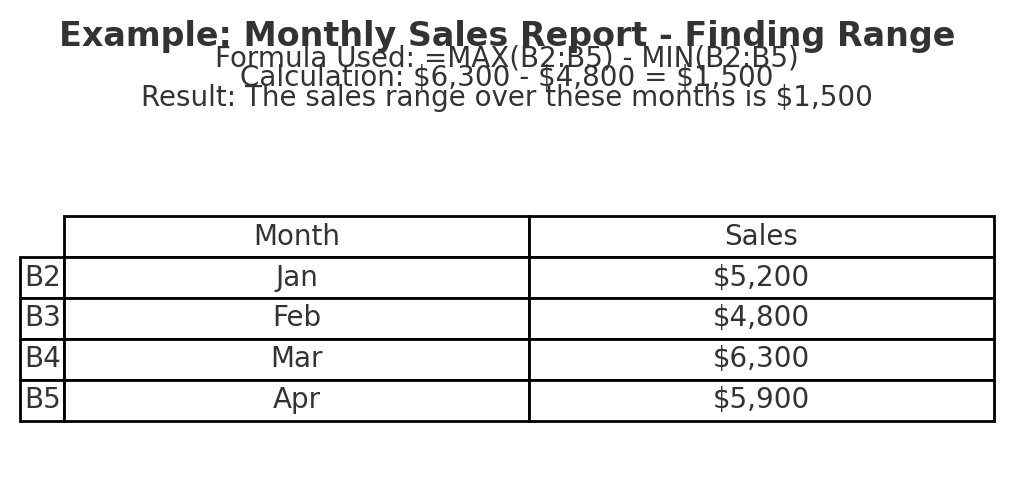
Example 2: Monthly Sales Report
| Month | Sales |
| Jan | $5,200 |
| Feb | $4,800 |
| Mar | $6,300 |
| Apr | $5,900 |
Formula:
=MAX(B2:B5)-MIN(B2:B5)
Output:
$6,300 – $4,800 = $1,500 → The sales range over these months is $1,500.
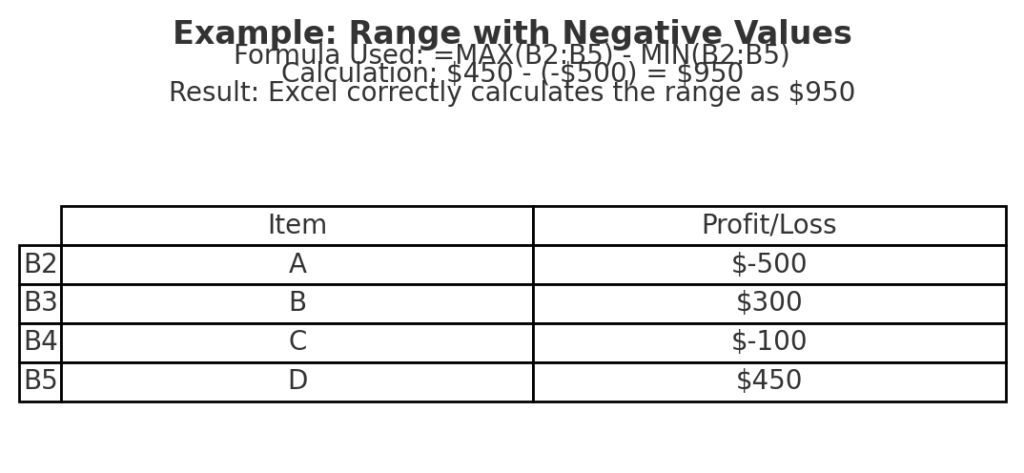
Example 3: Range with Negative Values
| Item | Profit/Loss |
| A | -500 |
| B | 300 |
| C | -100 |
| D | 450 |
Formula:
=MAX(B2:B5)-MIN(B2:B5)
Output:
450 – (-500) = 950 → Even with negatives, Excel calculates the spread correctly.
Benefits of Calculating Range in Excel
Quick Snapshot of Data Spread
The range gives an immediate idea of how spread out your data is. It’s helpful in understanding volatility, variation, or inconsistency.
Example:
- A small range in student test scores may indicate similar performance.
- A large range could mean some students excelled while others struggled.
Useful in Statistical Analysis
In statistics, the range is one of the basic measures of dispersion. It’s usually the first step before tackling more complex metrics like standard deviation or variance.
Simplifies Decision-Making
When you compare performance, like sales or prices, the range shows how much variation there is. This helps you:
- Set more accurate targets
- Identify outliers
- Make data-driven decisions
Works Across All Data Types
You can apply the range formula to:
- Financial data
- Inventory levels
- Customer ratings
- Temperature logs
- Sales reports
The calculation is universally applicable, making it a foundational tool in Excel.
Helps Identify Errors and Outliers
If your range is unexpectedly large or small, it could indicate:
- Data entry errors
- Missing values
- Duplicate entries
- Outliers that skew analysis
By calculating the range, you can quickly validate and clean your data.
How to Calculate Range in Excel
FAQ’s – Finding Range in Excel
Can I find range for text values?
No. The range applies to numerical data only. Use sorting or filtering for analyzing text.
What if I get a #VALUE! error?
Check for non-numeric entries in the selected range. Make sure all values are numbers, or use:
=MAX(A1:A10*1) – MIN(A1:A10*1)
as an array formula (press Ctrl + Shift + Enter if using older Excel versions).
Does Excel have a built-in “RANGE” function?
No. Excel doesn’t have a built-in function named RANGE, but you can calculate it manually using:
=MAX(range)-MIN(range)
What’s the difference between range and standard deviation?
- Range is the difference between the max and min values.
- Standard deviation measures how spread out the data is from the mean.
Both are measures of variability, but standard deviation is more complex.
Can I use the range formula across different sheets?
Yes. You can reference a range from another sheet like this:
=MAX(Sheet2!A1:A10)-MIN(Sheet2!A1:A10)
Conclusion
Finding the range in Excel is a simple yet powerful way to understand the variability of your data. The range helps you find extremes and spot outliers. Whether you’re tracking sales, scores, or any numbers, it also summarizes your dataset. In this guide, you learned how to use MAX() and MIN() to find range. You also explored real-life examples and saw why range is important in data analysis.