

If you use Excel for data—like in statistics or research—you’ve probably seen the term standard error. It’s key to see how a sample reflects a population. This measure helps in hypothesis testing, forecasting, and checking data reliability. This guide covers standard error. We’ll show you how to calculate it in Excel using various methods. You’ll find real-world examples and learn the benefits of using standard error in your analysis.
What is Standard Error?
Standard error (SE) shows how well a sample distribution reflects a population. It estimates the variability of the sample mean.
Formula for Standard Error:
SE=nStandard Deviation (SD)
Where:
- SD = Standard deviation of the sample
- n = Number of observations (sample size)
Key Points:
- A smaller SE indicates that the sample mean is a more accurate reflection of the population mean.
- SE is commonly used in confidence intervals and hypothesis testing.
How to Find Standard Error in Excel
You can calculate the standard error in Excel using different methods. It depends on your data’s structure. Below are the main approaches.
Method 1: Manual Formula Using STDEV.S and COUNT
This is the most accurate and transparent method for calculating SE from raw data.
Steps:
- Suppose your data is in cells A1 to A10.
- Use the formula:
=STDEV.S(A1:A10)/SQRT(COUNT(A1:A10))
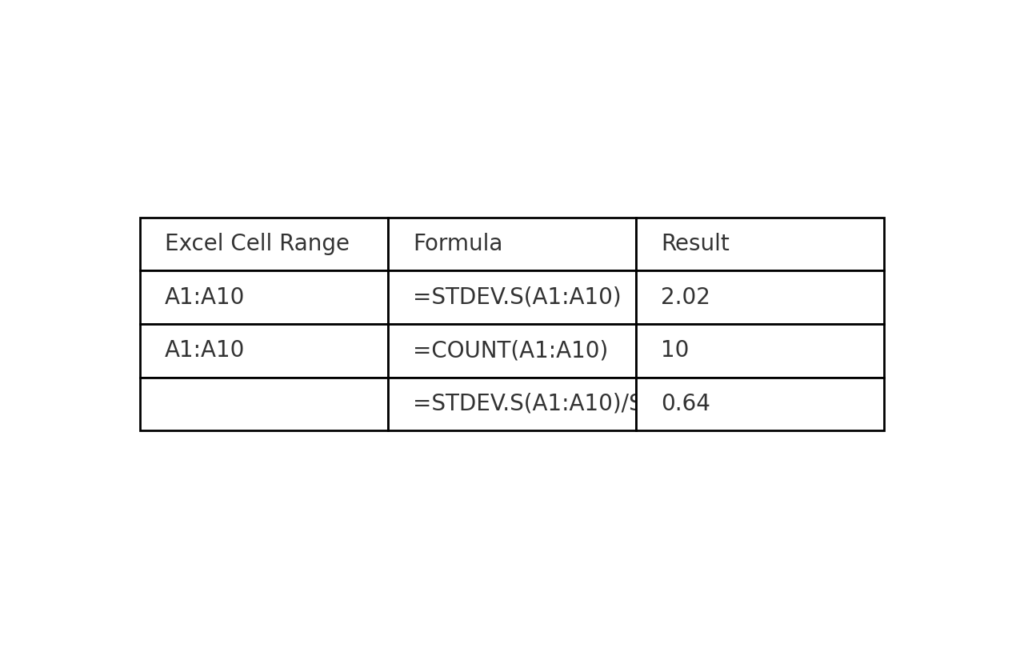
Explanation:
- STDEV.S() calculates the sample standard deviation.
- COUNT() counts the number of numeric values.
- SQRT() takes the square root of the sample size.
This method calculates the standard error directly.
Method 2: Use Data Analysis Toolpak (Descriptive Statistics)
Excel’s Data Analysis Toolpak is great for large datasets. It also provides helpful built-in summaries.
Steps:
- Go to File > Options > Add-ins.
- At the bottom, ensure “Excel Add-ins” is selected > Click Go.
- Check Analysis ToolPak > Click OK.
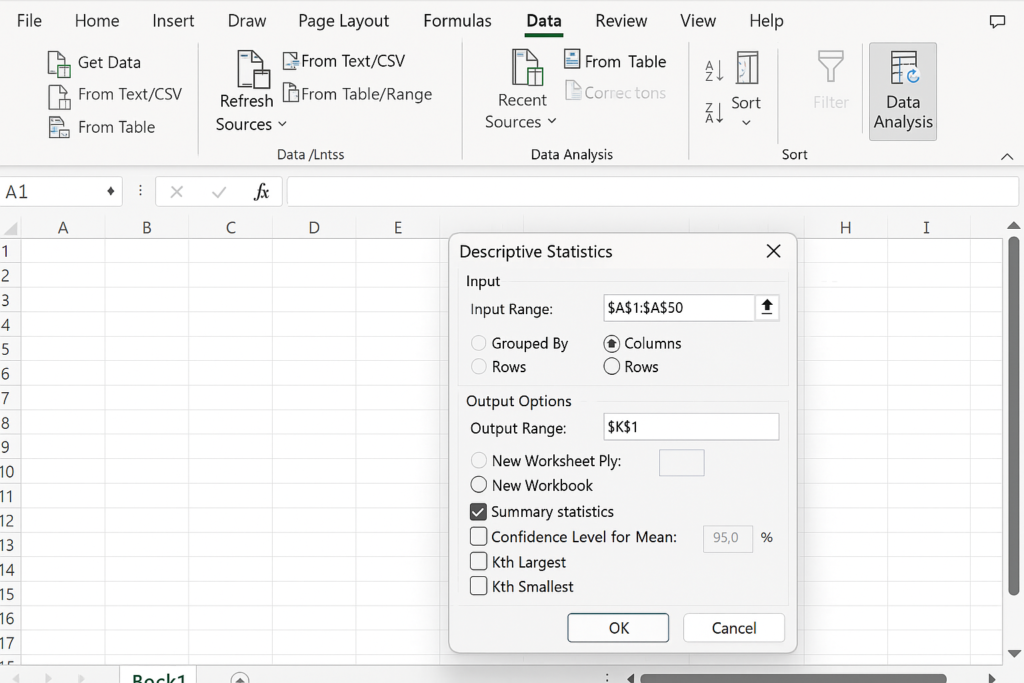
- Go to Data > Data Analysis.
- Select Descriptive Statistics.
- Choose your data range (e.g., A1:A50), check “Summary Statistics,” and hit OK.
Method 3: Create a Custom Function for Standard Error (Optional VBA)
For repeated use or automation, create a reusable VBA function.
VBA Code:
Function StandardError(rng As Range) As Double
StandardError = Application.WorksheetFunction.StDev_S(rng) / Sqr(Application.WorksheetFunction.Count(rng))
End Function
Use:
=StandardError(A1:A10)
Great for advanced users working on multiple projects.
Examples of Standard Error in Excel
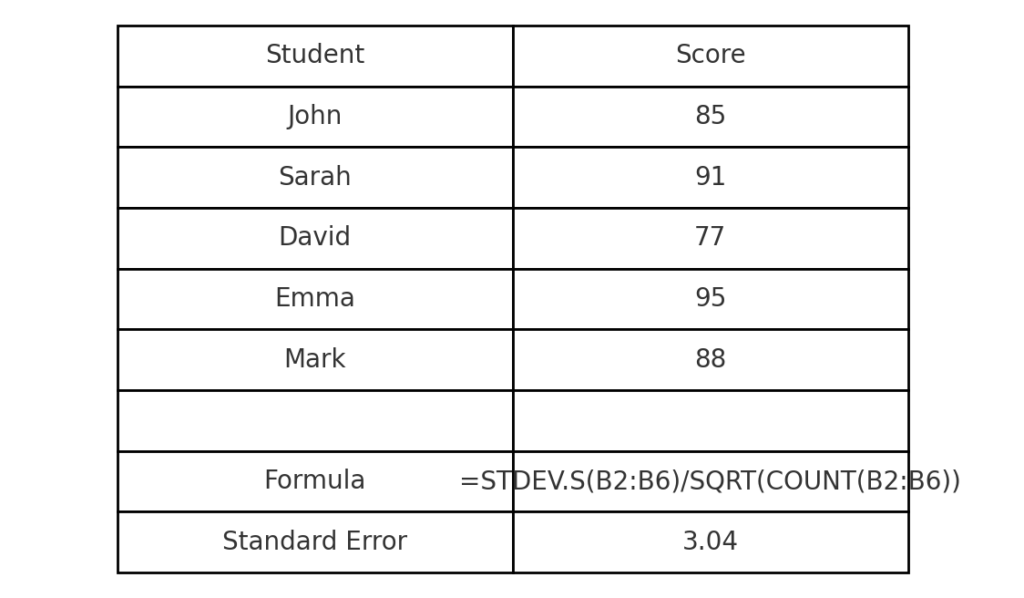
Example 1: Exam Scores
| Student | Score |
| John | 85 |
| Sarah | 91 |
| David | 77 |
| Emma | 95 |
| Mark | 88 |
Formula:
=STDEV.S(B2:B6)/SQRT(COUNT(B2:B6))
Output: Standard Error ≈ 3.08 (depending on exact SD and n)
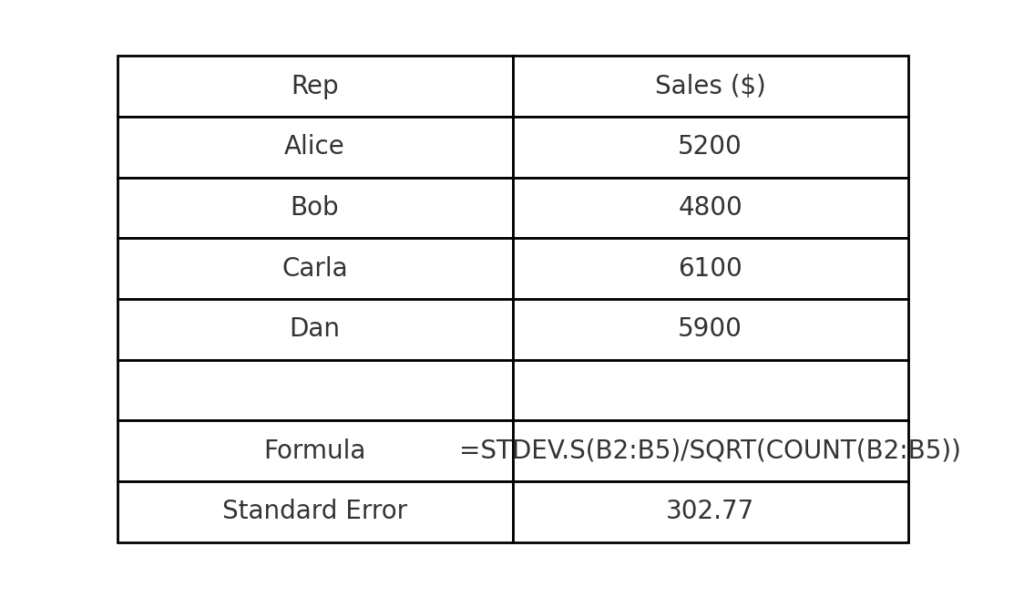
Example 2: Sales Performance
| Rep | Sales ($) |
| Alice | 5200 |
| Bob | 4800 |
| Carla | 6100 |
| Dan | 5900 |
=STDEV.S(B2:B5)/SQRT(COUNT(B2:B5))
Output: Standard Error ≈ 294.39
This tells you how much the average sales may vary due to sampling error.
Benefits of Calculating Standard Error in Excel
Assess Accuracy of Sample Mean
Standard error shows how much trust you can have in your sample mean. It tells you how well that mean reflects the real population mean. A small SE suggests high reliability.
Useful in Hypothesis Testing
In statistical analysis, SE helps determine the significance of a result. It’s used in:
- t-tests
- z-tests
- Confidence intervals
It helps validate whether differences between groups are likely real or due to chance.
Informs Forecasting and Predictive Analysis
In finance, marketing, and operations, SE helps check how reliable forecasts are. A lower SE implies more accurate predictive models.
Enables Clearer Data Interpretation
In reports and dashboards, including SE helps stakeholders understand data variability. It’s especially useful in presentations where visual insights matter.
Complements Other Statistical Measures
Standard deviation shows how individual data points vary. SE, on the other hand, looks at the variability of the mean. This focus on the mean is more useful in studies based on samples.
Boosts Trust and EEAT in Reports
Including SE in your reports increases trust and professionalism. It shows that:
- Your analysis is statistically sound.
- Your methodology is robust.
- You’re aligned with academic or industry standards.
Standard Error of the Mean in Excel
FAQ’s – Standard Error in Excel
What’s the difference between standard deviation and standard error?
- Standard Deviation (SD): Measures variability among individual data points.
- Standard Error (SE): Measures variability of the sample mean from the population mean.
SE = SD ÷ √n
Can Excel calculate standard error automatically?
Yes, through:
- Manual formula (STDEV.S(range)/SQRT(COUNT(range)))
- Descriptive Statistics (via Analysis Toolpak)
When should I use STDEV.S vs STDEV.P?
- Use STDEV.S when working with a sample (which is common).
- Use STDEV.P only when you have the entire population dataset.
Standard error typically uses STDEV.S.
What sample size is best for standard error?
Larger samples generally reduce SE and increase reliability. As n increases, SE decreases, which means the sample better estimates the population.
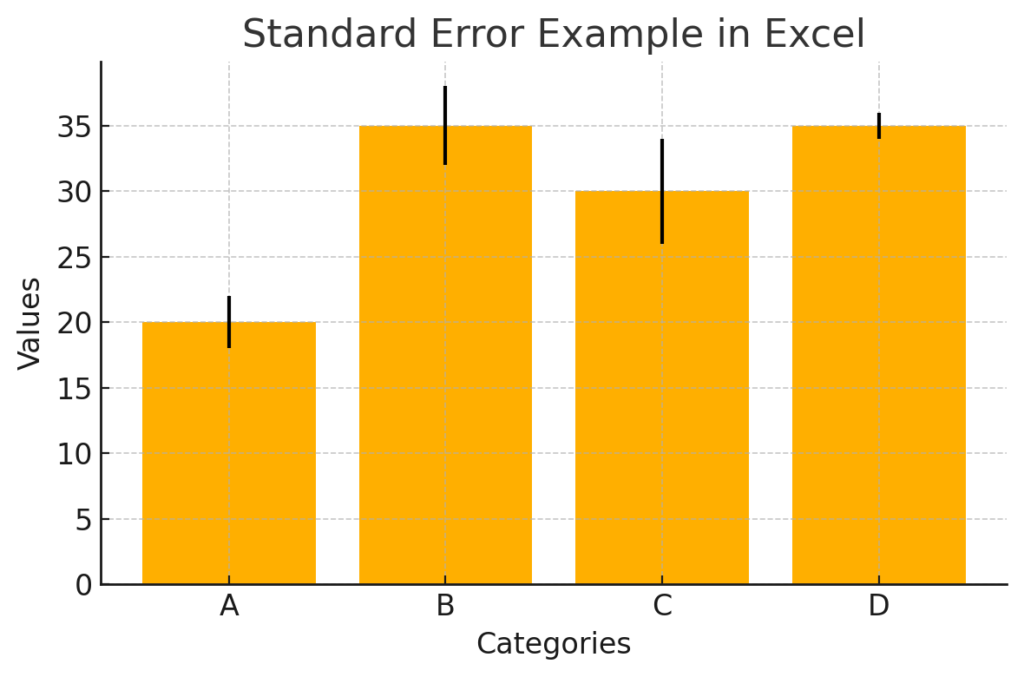
Can I visualize standard error in charts?
Yes. In Excel charts (e.g., line or bar charts), you can add error bars to represent standard error. Use:
- Chart > Add Chart Element > Error Bars > More Options
- Choose Custom and provide SE values.
Conclusion
Calculating standard error in Excel is key for anyone working with data. This skill is useful in scientific research, business reports, and academic analysis. Using the STDEV.S()/SQRT(COUNT()) formula helps you check how reliable your averages are.