

In data analysis, it’s common to compare datasets. This helps find overlapping or shared values, especially in Excel. Finding the intersection of two datasets can save time and boost accuracy. This skill is useful for matching customer lists, product SKUs, employee IDs, or survey responses. In this guide, you’ll discover what dataset intersection is. You’ll also learn how to find it in Excel using different methods like formulas, conditional formatting, and Power Query. Plus, you’ll see why this skill is important for good data management.
What is the Intersection of Two Datasets?
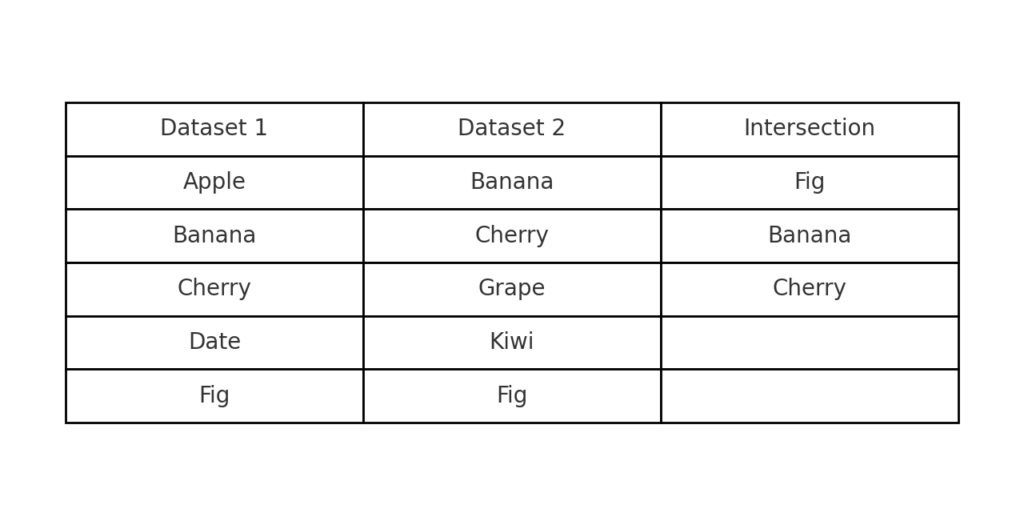
The intersection of two datasets refers to the common values that appear in both lists. In Excel, it means finding values that appear in two different ranges or columns.
For example, one list has customers who signed up for a newsletter. Another list has names of people who made purchases. The intersection shows customers who did both.
Real-World Examples:
- Finding students enrolled in two different courses
- Matching common product IDs across warehouses
- Identifying duplicate applicants in two departments
Excel provides multiple ways to find this intersection efficiently, even for large datasets.
How to Find the Intersection of Two Datasets in Excel
There are several methods to compare two datasets and identify common values. Each option has its benefits. It depends on your needs, data size, and if you want dynamic or static results.
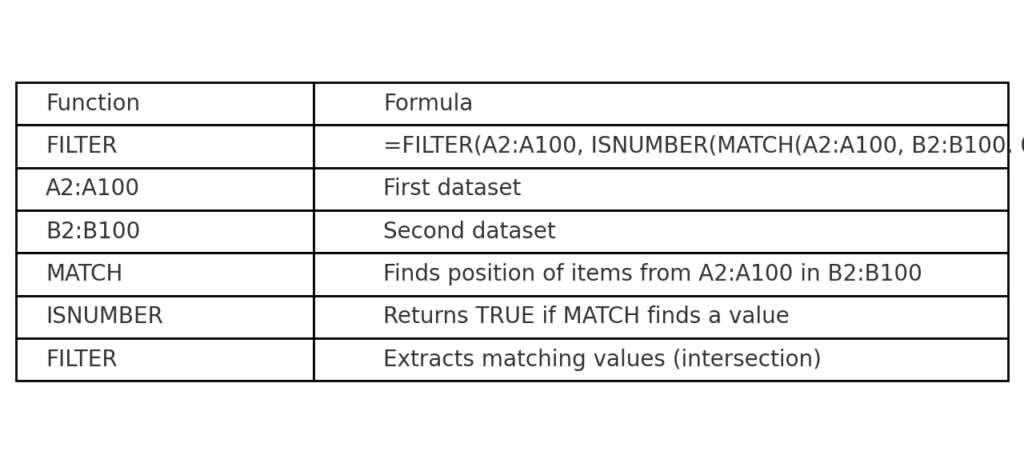
Method 1: Use the FILTER Function (Excel 365 and Excel 2021)
The FILTER function is perfect for finding intersections dynamically.
Formula:
=FILTER(A2:A100, ISNUMBER(MATCH(A2:A100, B2:B100, 0)))
Explanation:
- A2:A100: First dataset
- B2:B100: Second dataset
- MATCH: Checks each value in A2:A100 against B2:B100
- ISNUMBER: Confirms the presence of a match
- FILTER: Returns only the values that matched
This method is real-time and updates automatically if your data changes.
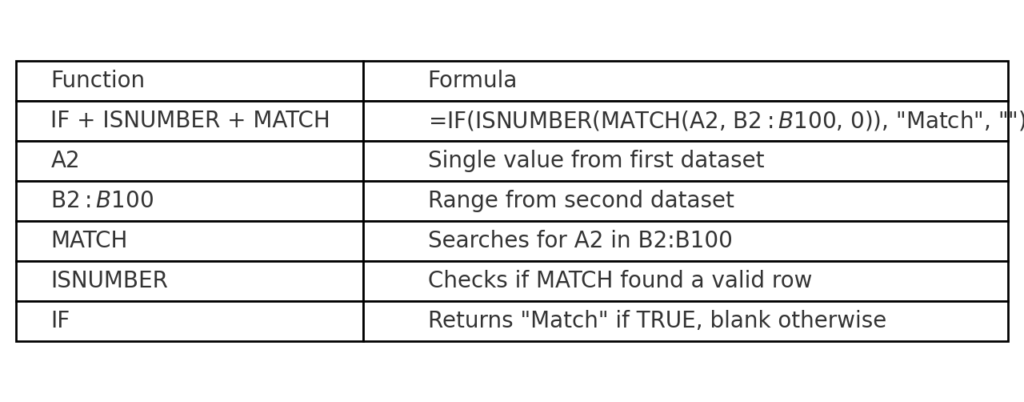
Method 2: Use the IF + ISNUMBER + MATCH Formula (All Excel Versions)
This approach flags matching values row by row.
Formula:
=IF(ISNUMBER(MATCH(A2, B$2:B$100, 0)), “Match”, “”)
Steps:
- Paste this in a helper column.
- Drag down to apply across your data.
- Filter rows where the result is “Match.”
Useful for basic intersection checking with compatibility across all Excel versions.
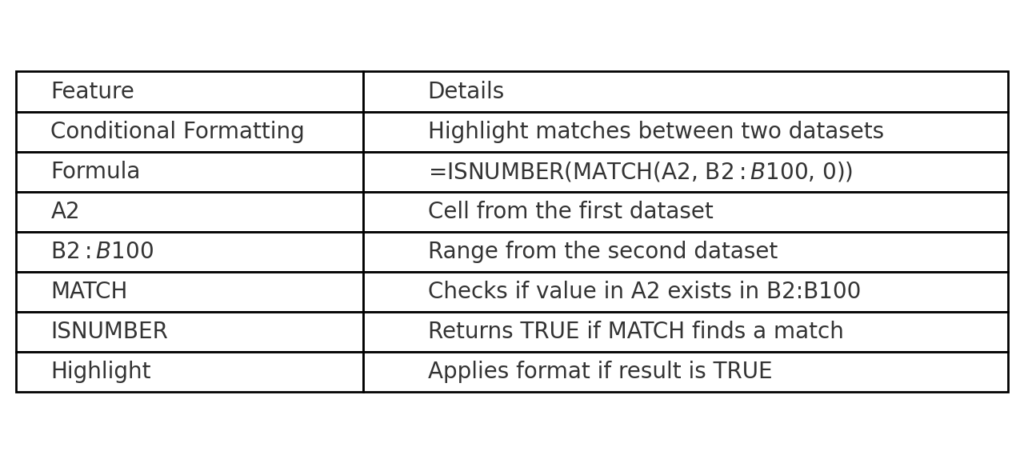
Method 3: Use Conditional Formatting to Highlight Matches
For visual comparison, use conditional formatting to highlight intersections.
Steps:
- Select the first dataset (e.g., A2:A100).
- Go to Home > Conditional Formatting > New Rule.
- Choose “Use a formula to determine which cells to format.”
- Enter:
=ISNUMBER(MATCH(A2, B$2:B$100, 0))
- Set your desired format (e.g., green fill).
Now, any value in List A that appears in List B will be highlighted.
Method 4: Use Power Query to Join and Find Intersections
For larger datasets or automation, Power Query is highly effective.
Steps:
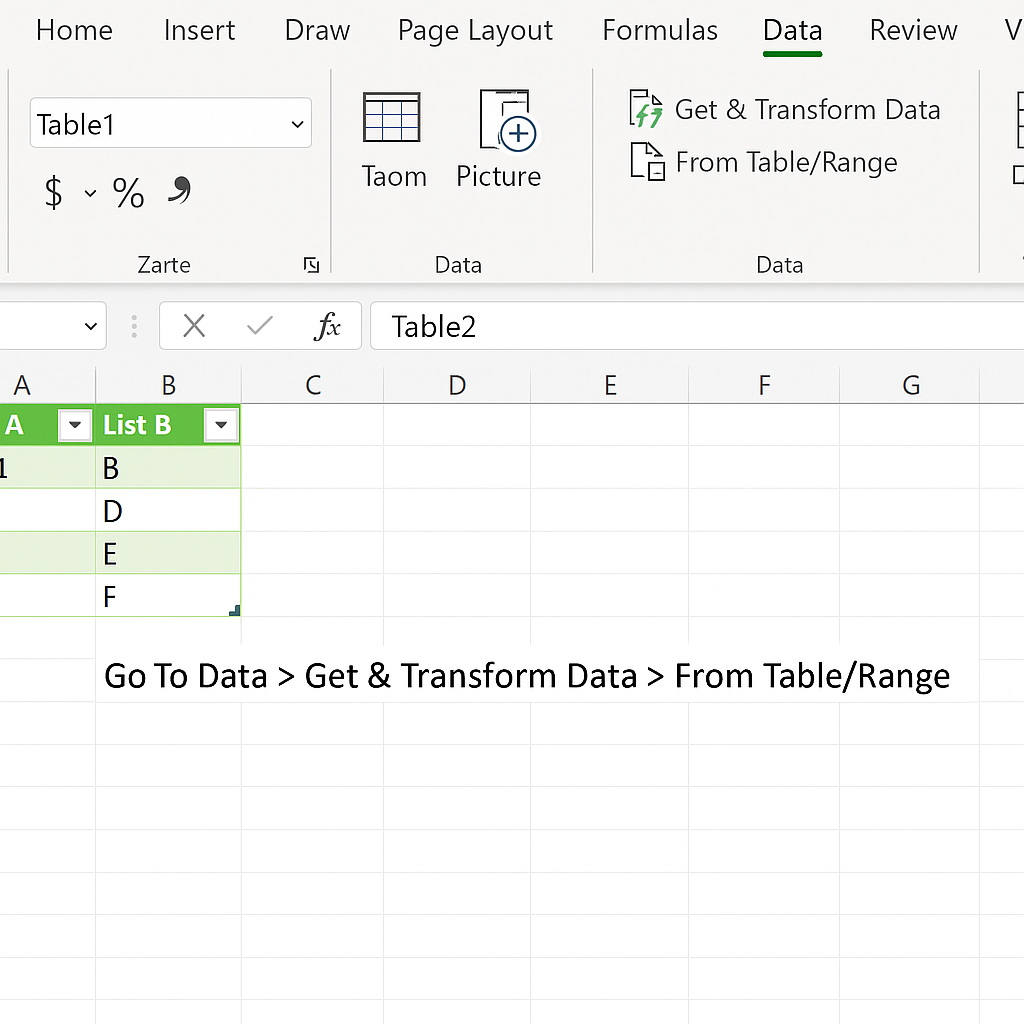
- Select each dataset and convert them to Tables using Insert > Table.
- Go to Data > Get & Transform Data > From Table/Range.
- Load both tables into Power Query Editor.
- In one table, go to Home > Merge Queries.
- Choose the second table and select the matching column.
- Set the join type to Inner Join (returns only matching rows).
- Click OK > Close & Load.
Power Query will return only the intersecting values between the two datasets.
Examples of Dataset Intersection in Excel
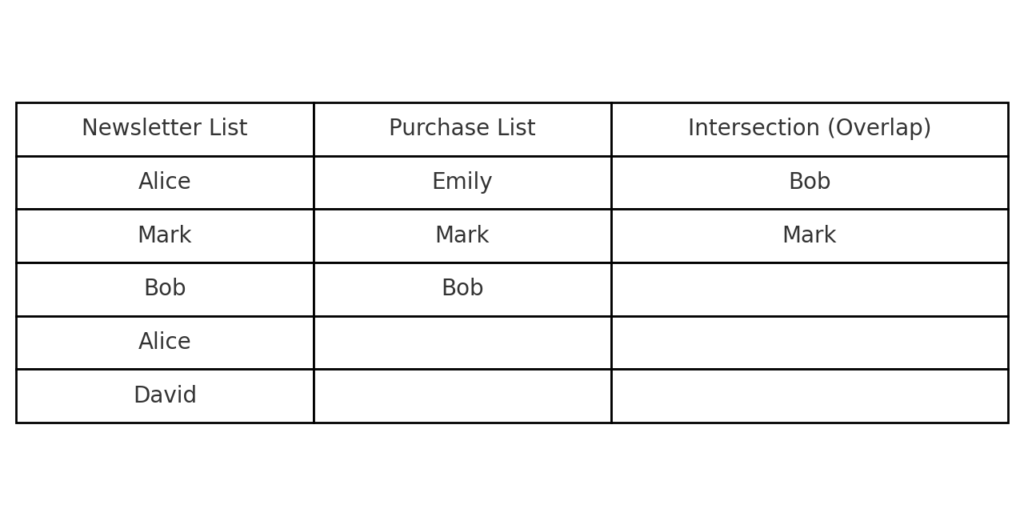
Example 1: Customer Overlap
| Newsletter List | Purchase List |
| Alice | Mark |
| Bob | Alice |
| David | Emily |
| Mark | Bob |
Using the intersection method, the result will be: Alice, Bob, Mark
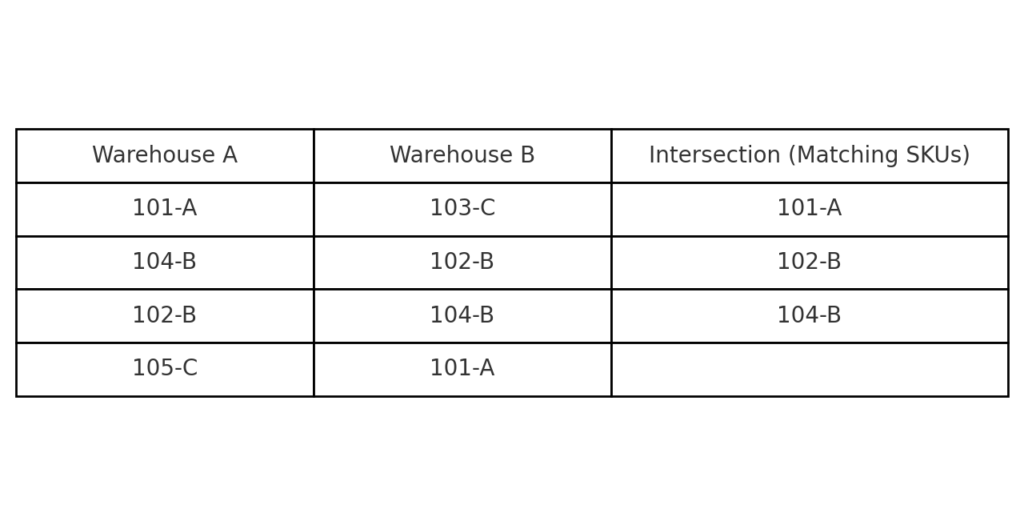
Example 2: Matching Product SKUs
| Warehouse A | Warehouse B |
| 101-A | 104-B |
| 102-B | 105-C |
| 103-C | 102-B |
| 104-B | 101-A |
Intersection: 101-A, 102-B, 104-B
This helps in inventory reconciliation between locations.
Benefits of Finding the Intersection of Two Datasets in Excel
Helps in Data Cleansing
To handle duplicates, missing data, or inconsistent entries, look for intersecting values. This way, you can see what’s valid and what needs fixing. You can:
- Detect repeated records
- Merge datasets more effectively
- Clean up redundancies
Supports Better Decision-Making
Intersecting values show key overlaps. For example, customers might use different touchpoints, or products may shift between stores. This insight:
- Helps segment high-value users
- Identifies common trends
- Aids in cross-functional decisions
Streamlines Reporting
Finding the intersection automates the work of manually comparing lists, especially in:
- Marketing analysis
- Financial reporting
- Project management
With Excel formulas or Power Query, you generate fast, accurate summaries that can be reused.
Improves Accuracy in Data Merging
Before merging two datasets, confirming the intersection ensures you’re not overwriting or duplicating incorrect records. It ensures:
- Clean joins
- Accurate relationships
- Consistent structures
Reduces Human Error
Manual comparison is slow and error-prone. Automating the process using Excel’s MATCH, FILTER, or Power Query ensures:
- Fewer mistakes
- Clear traceability
- Repeatable processes
Boosts Productivity in Large Projects
For businesses managing thousands of rows, such as CRM data or sales transactions, automating intersection tasks offers:
- Faster turnarounds
- Time savings for analysts
- Reduced need for third-party tools
Standard Error of the Mean in Excel
FAQ’s
How do I compare two datasets to find matches in Excel?
You can use formulas like =IF(ISNUMBER(MATCH(A2, B$2:B$100, 0)), “Match”, “”) to check for common values between columns. Excel will return “Match” for each row found in both datasets.
What’s the best formula to use for intersection in Excel?
The best method is =FILTER(A2:A100, ISNUMBER(MATCH(A2:A100, B2:B100, 0))). This shows all the overlapping values.
Can I find intersections without using formulas?
Yes. Use Conditional Formatting, Advanced Filter, or Power Query to spot matches. You can do this without writing any formulas.
Is Power Query better for large datasets?
Absolutely. Power Query handles thousands of rows faster and provides reusable logic. It’s ideal for professional workflows and recurring reports.
Conclusion
Finding the intersection of two datasets in Excel is a key skill. It boosts your data analysis, reporting, and decision-making abilities. Excel provides flexible solutions for every situation. You can use formulas like MATCH, tools like Power Query, or visual aids like Conditional Formatting. This guide offers several methods, clear steps, real examples, and benefits. It will help you understand and use this technique confidently.