

In data analysis, finance, academic grading, and business reporting, values differ. That’s where the concept of a weighted average becomes essential. A weighted average is different from a simple average. It gives more importance to some numbers. This is based on their assigned weight. Microsoft Excel is a popular tool for data calculations. It offers several easy ways to compute this efficiently. This guide will help you understand weighted averages in Excel. You’ll learn what they are, how they work, and practical methods. We’ll also share real-world examples, benefits, and common questions.
What is the Weighted Average?
A weighted average is an average that gives different numbers different importance. Each number in the dataset adds to the average based on its weight. This is helpful when some values should impact the result more than others.
For example, in a class, a final exam might count for 50% of the grade, while quizzes and assignments count for less. Averaging all scores won’t show the true performance based on importance.
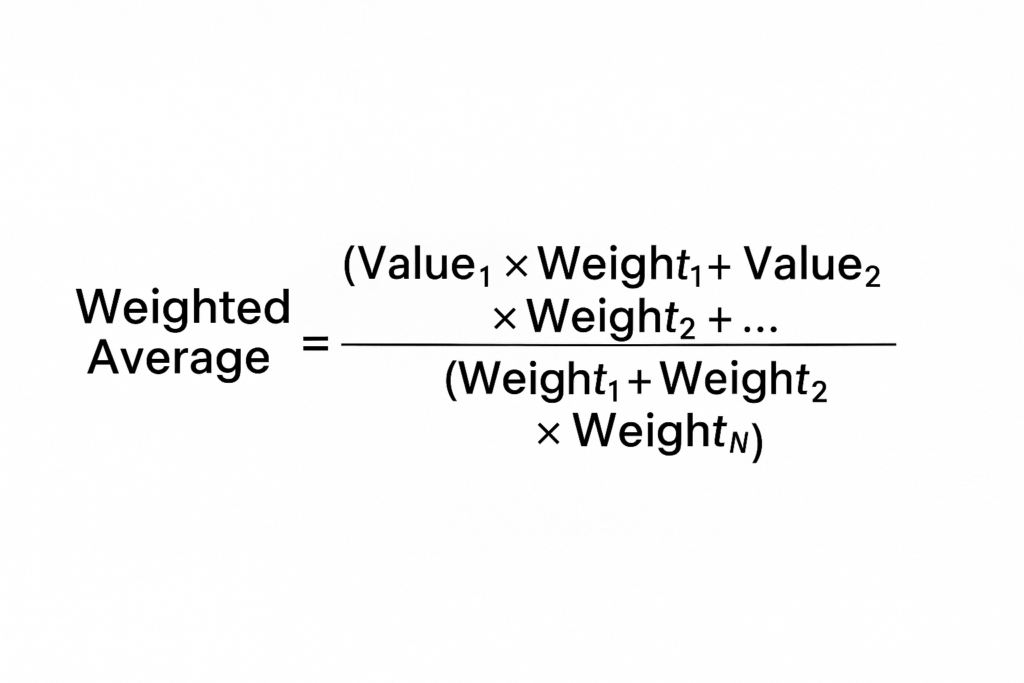
Formula for weighted average:
Weighted Average = (Value1 × Weight1 + Value2 × Weight2 + … + ValueN × WeightN) ÷ (Weight1 + Weight2 + … + WeightN)
This method makes sure that important or frequent items have a bigger impact on the final result.
How to Find Weighted Average in Excel
Excel offers various methods to calculate a weighted average. The right method depends on how your data is organized. Here are the most reliable and commonly used ways:
Using SUMPRODUCT and SUM Functions
This is the best way to calculate weighted averages in Excel.
Step-by-Step:
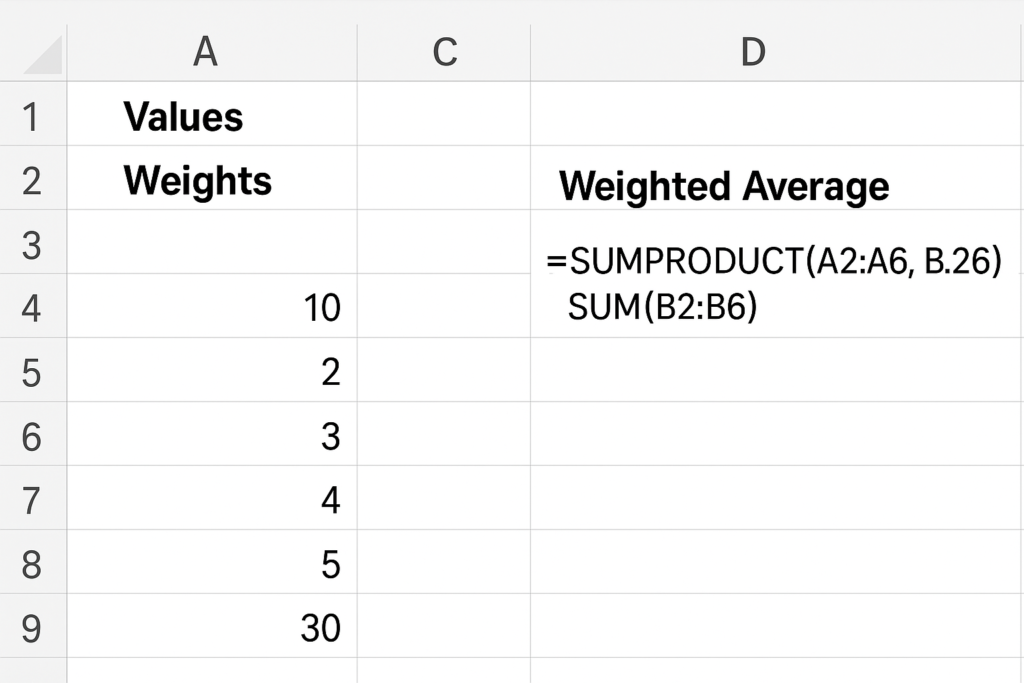
- Suppose you have: Values in cells A2:A6 and Weights in cells B2:B6.
- Enter the following formula in any empty cell:
=SUMPRODUCT(A2:A6, B2:B6) / SUM(B2:B6)
Explanation:
- SUMPRODUCT multiplies each value by its corresponding weight.
- SUM adds all the weights together.
- The result is the weighted average.
Using Excel Table for Dynamic Weighted Averages
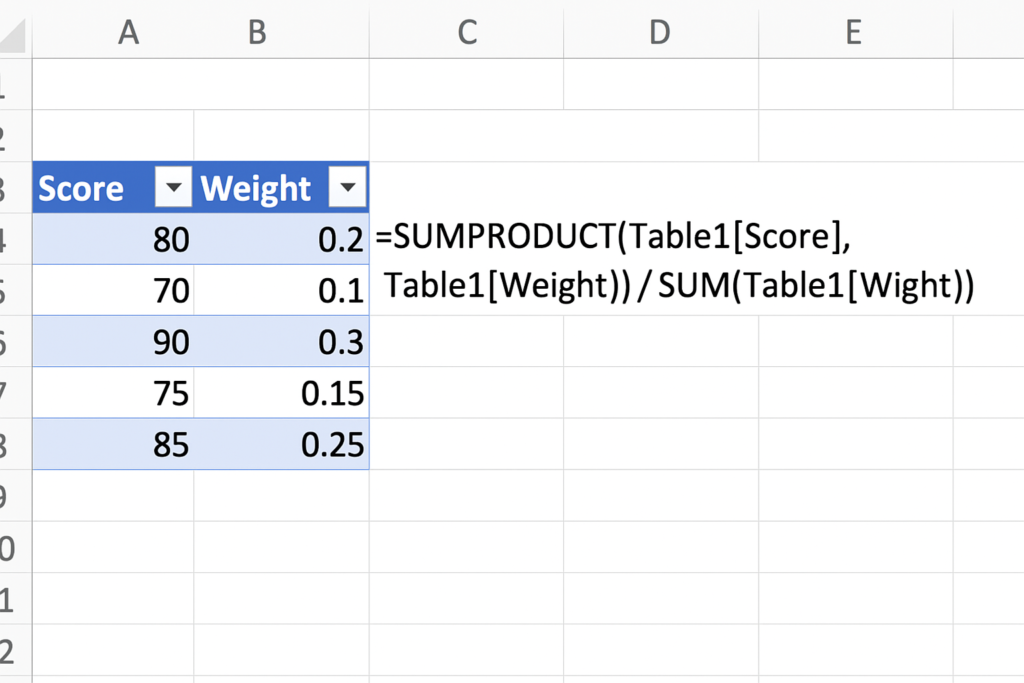
If you convert your data range into a table, formulas will automatically update as you add more rows.
- Select your data and press Ctrl + T to create a table.
- Use the same SUMPRODUCT formula with table column references:
=SUMPRODUCT(Table1[Score], Table1[Weight]) / SUM(Table1[Weight])
This is useful when working with dynamic data that updates frequently.
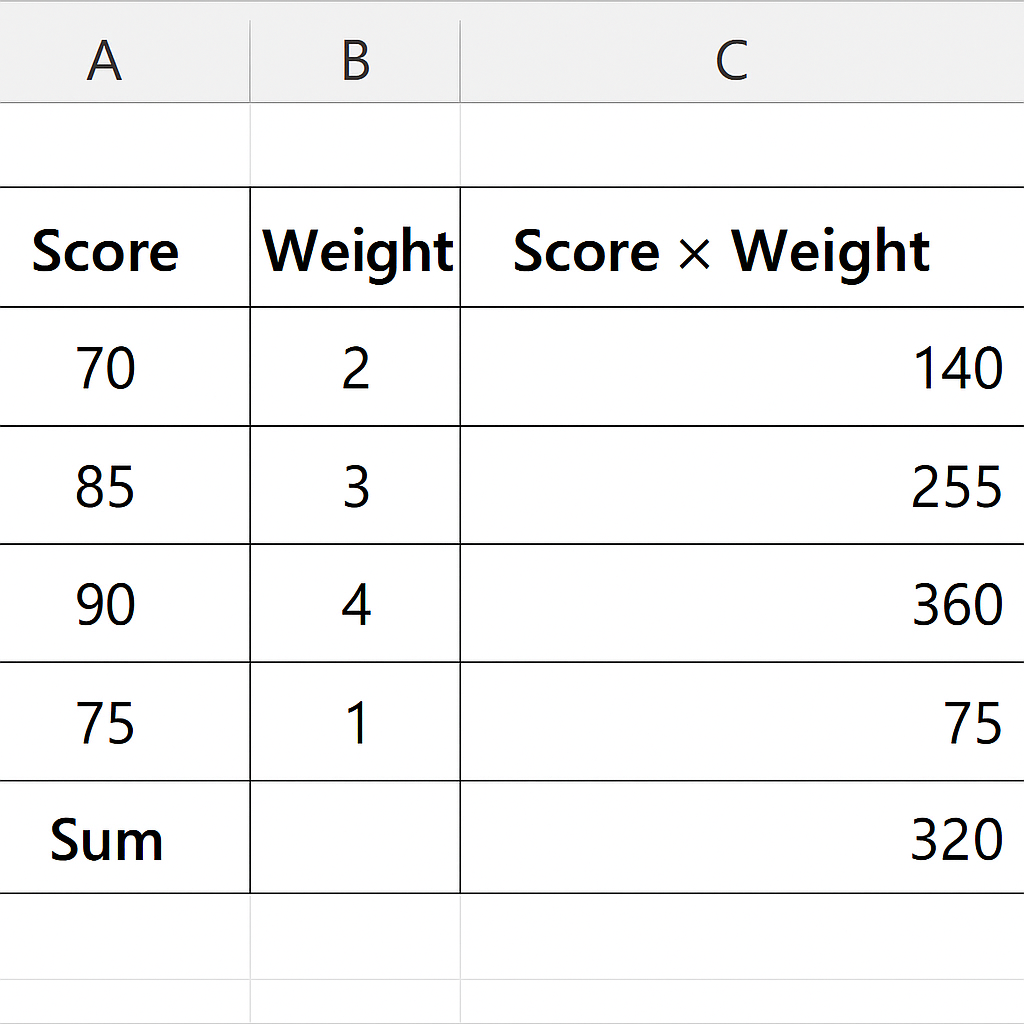
Manual Multiplication + SUM
For small datasets or beginners:
- Create a new column to multiply each value by its weight.
- Sum the results of the multiplications.
- Divide by the total of all weights.
While this takes more steps, it makes the concept visually clear.
Examples
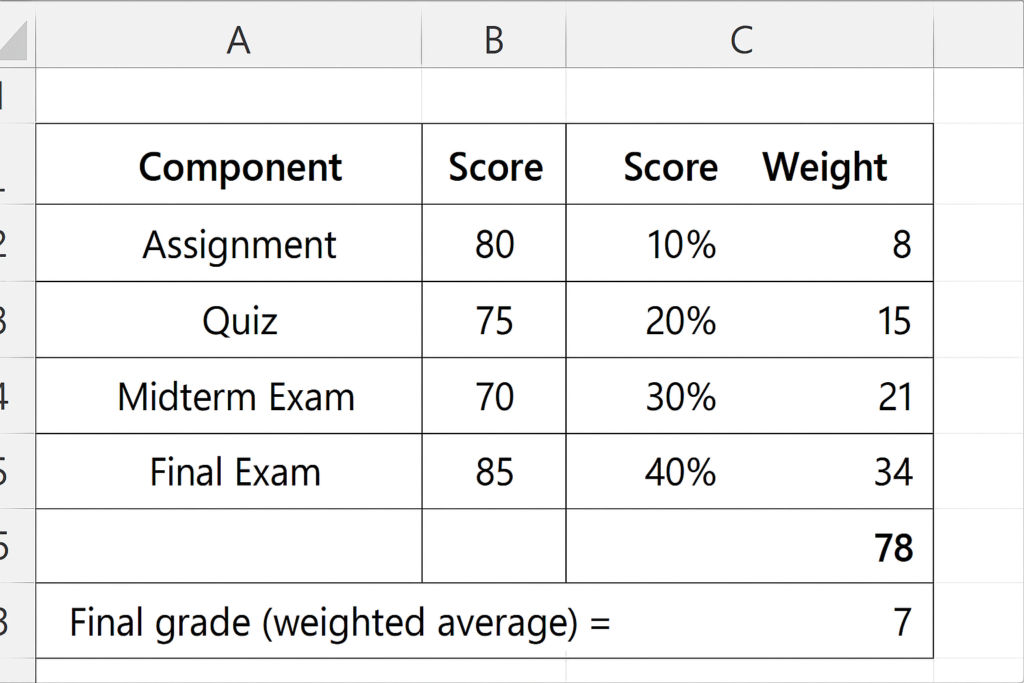
Example 1: Student Grade Calculation
| Component | Score | Weight |
| Assignment | 80 | 10% |
| Quiz | 75 | 20% |
| Midterm Exam | 70 | 30% |
| Final Exam | 85 | 40% |
To calculate the final grade:
- Convert weights into decimals: 10% → 0.1, etc.
- Multiply each score by its corresponding weight:
- 80×0.1 = 8
- 75×0.2 = 15
- 70×0.3 = 21
- 85×0.4 = 34
- Add all the results: 8 + 15 + 21 + 34 = 78
Final grade (weighted average) = 78
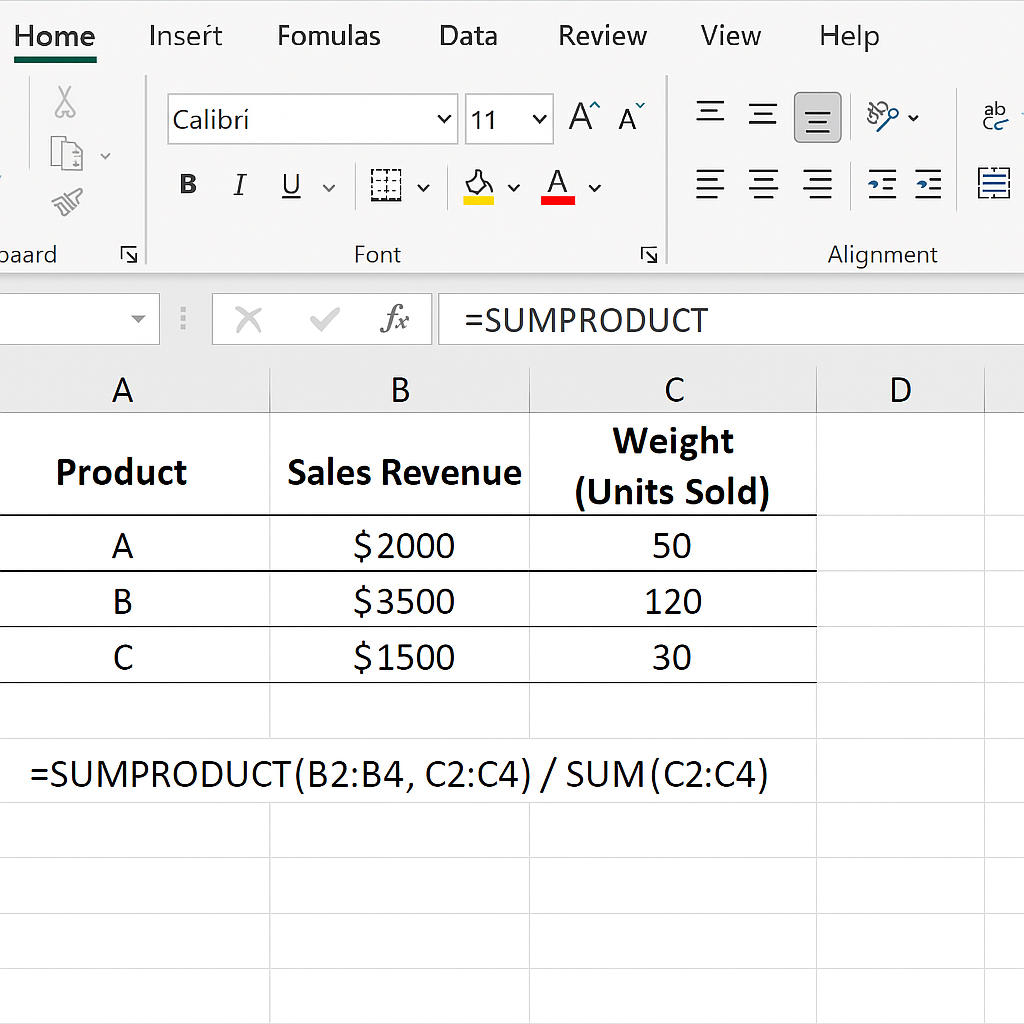
Example 2: Sales Revenue Contribution
| Product | Sales Revenue | Weight (Units Sold) |
| A | $2000 | 50 |
| B | $3500 | 120 |
| C | $1500 | 30 |
Using Excel:
=SUMPRODUCT(B2:B4, C2:C4) / SUM(C2:C4)
This gives a revenue-per-unit that accounts for how many units were sold of each product.
Benefits of Using Weighted Average in Excel
Accurate Performance Measurement
Weighted averages ensure that more significant items affect results appropriately. For example, final exams affect grades more than a quiz. Using a simple average here would be misleading.
Better Business Decision-Making
In business, not all customers or products have equal value. Calculating weighted averages, like revenue per product based on units sold, helps decision-makers use resources better.
Fair Grading Systems
Academic evaluations often require fairness based on test difficulty or duration. Weighted averages allow instructors to assign correct importance to exams, projects, and participation.
Clear Financial Forecasting
In financial models, you might weigh revenue projections by probability of occurrence. Weighted averages allow forecasting with a risk-adjusted view of potential outcomes.
Dynamic Calculation with Excel Tables
When using tables, formulas auto-update. This reduces errors in big datasets. It also helps with live dashboards and monthly reports. You won’t need to recalculate manually all the time.
Supports Automation via VBA and Macros
Weighted averages can be calculated in Excel VBA scripts for recurring tasks. This supports large organizations and data teams in automating insights.
How To Calculate A Weighted Average In Excel (With Percentages!)
FAQ’s
Can I calculate a weighted average if some weights are missing?
Yes, but only if you adjust the formula accordingly. Excel will return an error if you mismatch ranges. Make sure weights exist for each value or assign a default.
Is it better to use SUMPRODUCT or AVERAGE in Excel for weighted averages?
Use SUMPRODUCT. The AVERAGE function treats all values equally and does not account for weight. SUMPRODUCT is the standard method for weighted average.
Can I use weighted averages with percentages in Excel?
Yes, just convert the percentage weights to decimal format (e.g., 20% as 0.2). Excel does not distinguish between integers and decimals in SUMPRODUCT.
What happens if total weight is zero in my formula?
Dividing by zero will cause a #DIV/0! error. Make sure your total weights always add up to a positive number, or wrap the formula with an error handler like:
=IF(SUM(B2:B6)=0, “Invalid Weights”, SUMPRODUCT(A2:A6, B2:B6)/SUM(B2:B6))
Conclusion
Knowing how to calculate a weighted average in Excel is essential for many professionals. This skill is useful in finance, education, marketing, and analytics. It helps you interpret data better. It gives real importance to each value in your dataset. This way, your insights are more accurate and fair. You can use Excel’s functions like SUMPRODUCT, SUM, and Tables to make weighted calculations quickly and accurately. Weighted averages provide clear insights. You can use them for grading students, analyzing business performance, or forecasting financial trends. Raw averages can miss important details.