

In today’s busy work world, planning and tracking projects are key to success. Timelines are key tools for seeing milestones and deadlines. You need them, whether you’re running a marketing campaign, launching a product, doing research, or managing business operations. Microsoft Excel is known for data entry and calculations. But it’s also a strong tool for making professional timelines. This article covers what a timeline is, how to create one in Excel, and some examples. We’ll also look at the benefits, answer common questions, and wrap it all up in the conclusion.
What is a Timeline?
A timeline is a visual representation of a sequence of events in chronological order. It helps people or teams know when certain tasks or milestones should happen in a project or process. Timelines are useful in many areas. They help in project management, education, event planning, research, and business reporting.
Key characteristics of a timeline:
- Shows events or milestones along a linear progression.
- Can be formatted horizontally or vertically.
- Helps with scheduling, planning, and progress tracking.
- Ideal for both short-term and long-term projects.
How to Make a Timeline in Excel?
Creating a timeline in Excel can be done manually or by using templates and charts. Here’s a step-by-step guide:
Open a New Excel Workbook
Start with a clean spreadsheet to avoid clutter and confusion.
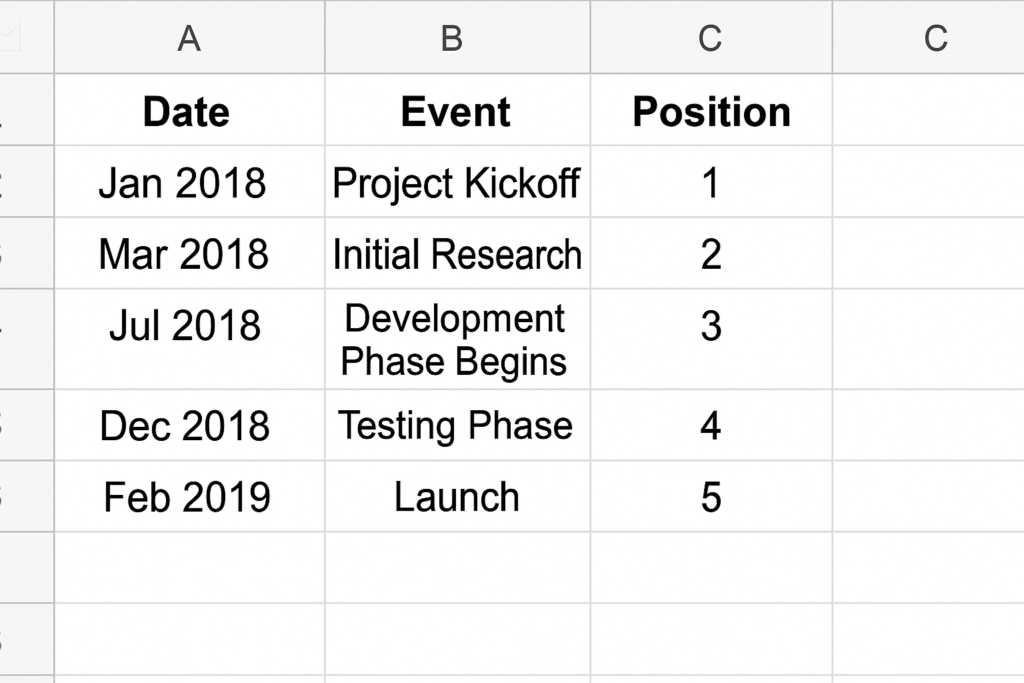
Enter Your Data
Create columns for:
- Date
- Event/Task
- Details (Optional)
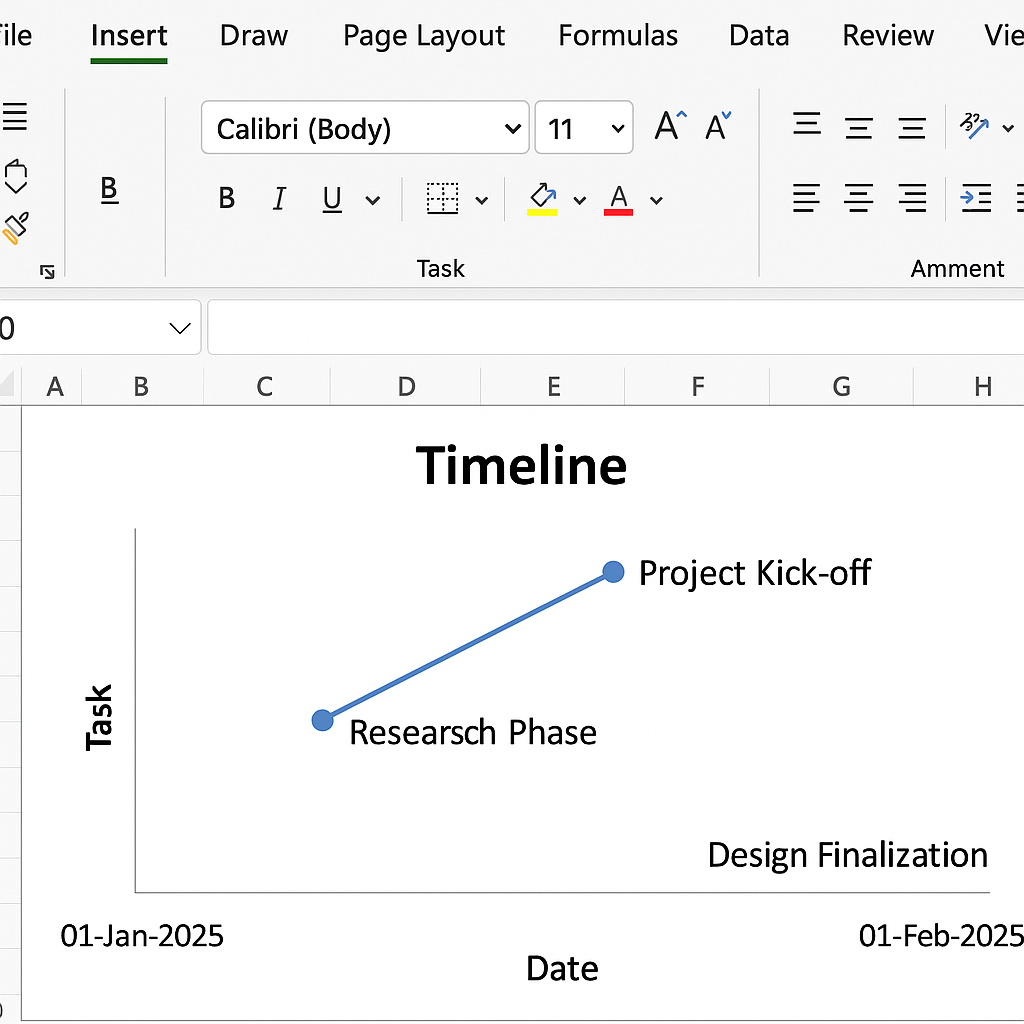
Example:
| Date | Task |
| 01-Jan-2025 | Project Kick-off |
| 15-Jan-2025 | Research Phase |
| 01-Feb-2025 | Design Finalization |
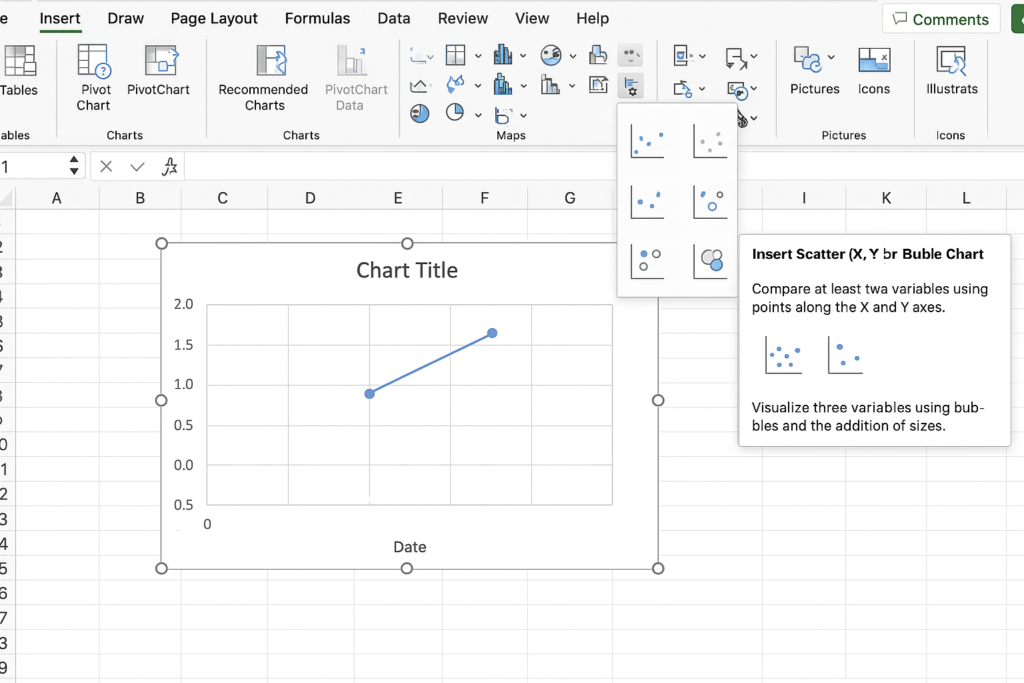
Insert a Scatter or Bar Chart
- Go to the Insert tab.
- Click on Insert Scatter (X, Y) or Bar Chart.
- Choose a Scatter with Straight Lines or Stacked Bar Chart (depending on preference).
Customize the Chart
- Right-click and choose Select Data to map your dates and events.
- Format axes to display dates and labels clearly.
- Add Data Labels, Markers, and Color Formatting to enhance readability.
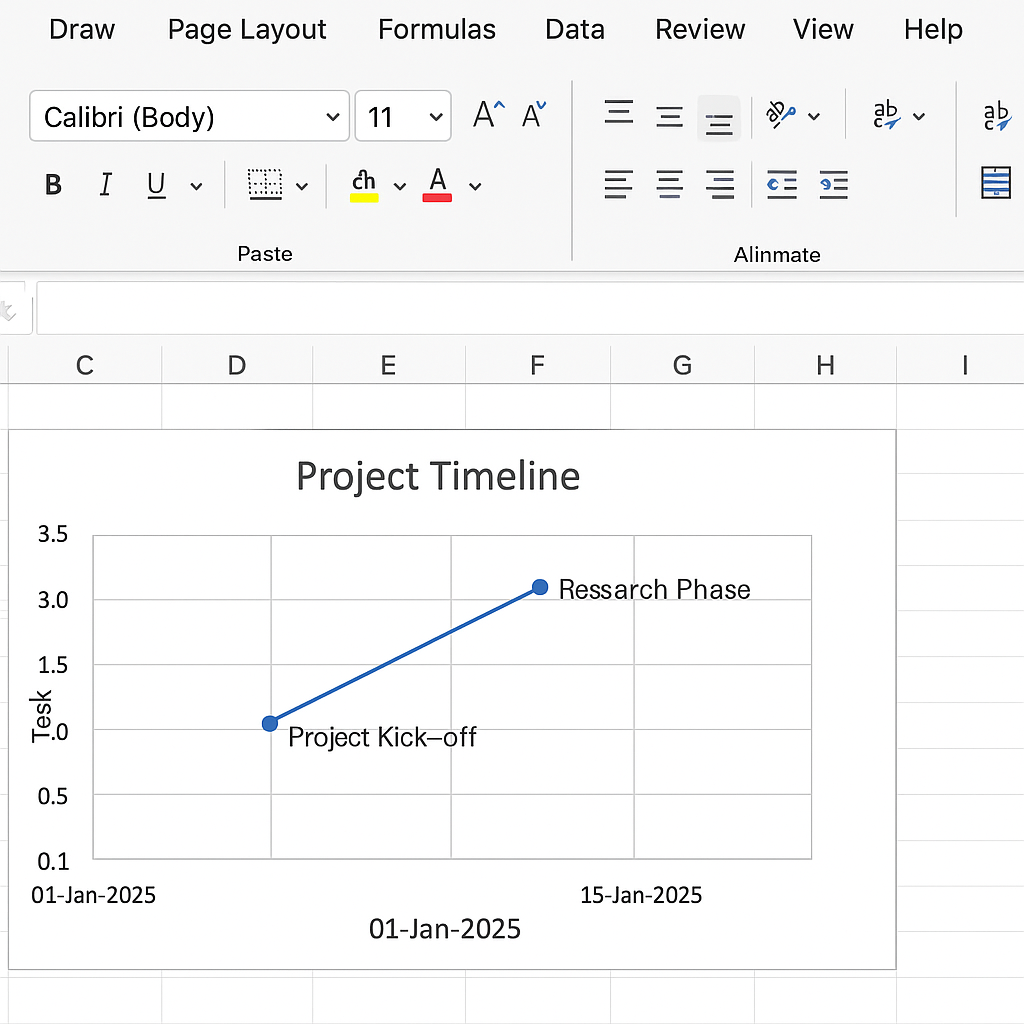
Adjust Layout and Design
Use Excel’s Chart Tools to:
- Change fonts and colors for better clarity.
- Add a title to your timeline.
- Remove gridlines if not needed.
- Use SmartArt for more visually engaging layouts (optional).
Examples of Timeline in Excel
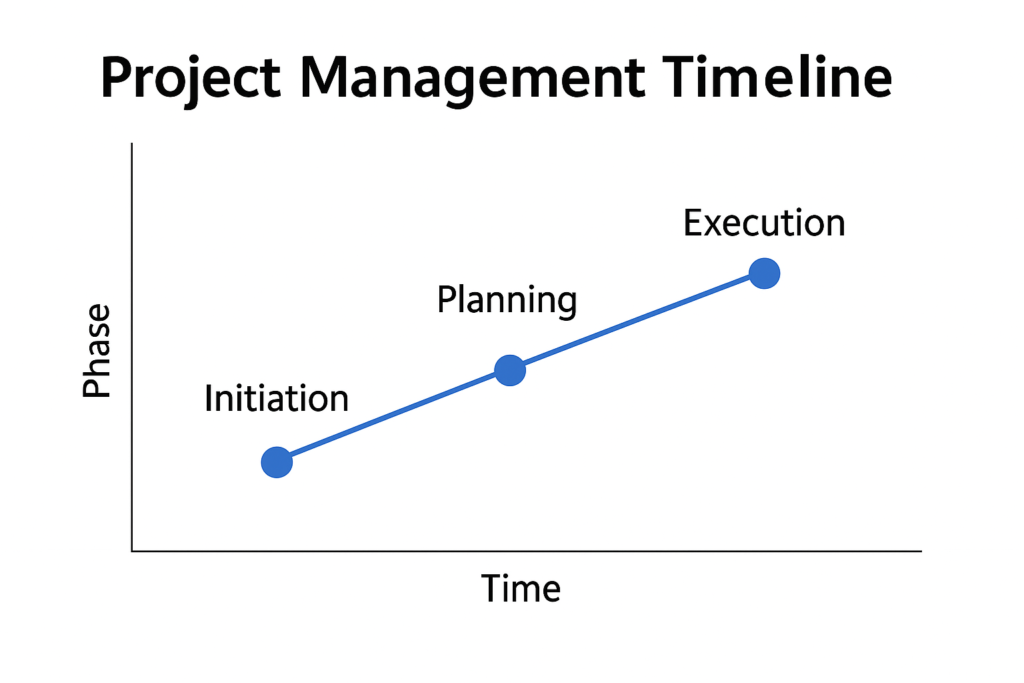
Project Management Timeline
A chart showing the phases: Initiation, Planning, Execution, and Closure. It includes milestone markers for each phase.
Event Planning Timeline
For organizing tasks like booking venues, sending invites, catering, etc., with respective deadlines.
Academic Timeline
Used by students to track assignment deadlines, exam dates, and research progress.
Marketing Campaign Timeline
Visualizes the campaign launch phases: content creation, ad launch, analytics tracking, and more.
Personal Development Timeline
Set and monitor goals like certifications, learning milestones, and habit tracking.
Benefits of Making Timeline in Excel
- Clarity and Visual Communication: Timelines transform scattered dates and tasks into a clear visual flow. A good timeline, whether shown in a team meeting or in a report, helps everyone grasp the project’s path.
- Customizability: Unlike many timeline-specific tools, Excel allows deep customization like Color-code milestones, Add notes or hyperlinks and , Modify layouts to match your brand or documentation style.
- Ease of Use: With familiar Excel features, you don’t need new software or technical expertise. Excel is flexible, allowing both beginners and experts to create timelines easily.
- Cost-Effective: Most users already have Excel through Microsoft 365 or a workplace license. You don’t need to invest in extra tools for basic timeline visualization.
- Integrates with Other Excel Data: You can link your timeline to other sheets. For example, you can connect it to budget plans, resource allocations, or task lists. This creates a dynamic, data-driven view.
- Supports Data-Driven Decisions: Timelines gather all events in one place. This helps track dependencies, find bottlenecks, and make quick adjustments.
FAQ’s about Making Timelines in Excel
Can I create a Gantt chart in Excel?
Yes! A Gantt chart is a type of timeline that shows task durations. You can use bar charts and conditional formatting to build one in Excel.
Are there Excel templates for timelines?
Absolutely. Microsoft offers built-in and downloadable timeline templates in Excel. You can also find premium templates online for specific use cases.
How do I update a timeline?
Simply update the date or task list in your Excel table. If your chart is linked to this data, it will auto-update accordingly.
Can I automate my timeline with VBA?
Yes. Advanced users can use VBA scripts. These scripts help create interactive timelines or auto-updating ones based on input data.
Is Excel better than dedicated timeline software?
Excel is great for fast, customizable timelines. It works even better when you combine it with other business data. For complex projects, tools like Microsoft Project or Trello can provide advanced features.
Conclusion
Making a timeline in Excel is a smart and easy way to organize events, tasks, and milestones. It’s flexible too. It helps you see workflows, track progress, and share timelines easily. You can do all this without leaving Excel. You can quickly create timelines for personal use, team coordination, or client reports. Just follow the step-by-step guide above.