

Understanding how variables relate is key to data analysis, forecasting, and making decisions. One of the most powerful tools for this is regression analysis—and yes, you can run it right in Excel. Excel simplifies regression for all—students, researchers, marketers, and business analysts—using its built-in Data Analysis Toolpak. This guide will walk you through everything from what regression means, how to use it in Excel, to real-world examples and benefits.
What is Regression?
Regression helps us see the connection between a dependent variable and one or more independent variables.
In simpler terms, it answers questions like:
- How does advertising spend affect sales?
- Does experience influence salary?
- Can we predict temperature based on altitude?
Types of Regression:
- Linear Regression: Most common; models a straight-line relationship.
- Multiple Regression: Uses two or more predictors.
- Logistic Regression: For categorical outcomes (not covered in Excel natively).
How to Run Regression in Excel?
Before running regression, ensure your Excel has the Data Analysis Toolpak enabled.
Step 1: Enable the Data Analysis Toolpak
- Go to File > Options > Add-Ins.
- At the bottom, set Manage to Excel Add-ins > click Go.
- Check Analysis ToolPak and click OK.
Now, under the Data tab, you’ll see Data Analysis in the ribbon.

Step 2: Prepare Your Data
Make sure your data is structured properly:
Sales (Y)Ads (X)20050250603007035080
The dependent variable (Y) goes in one column, and the independent variable (X) in another.

Step 3: Run Regression
- Click the Data tab > Data Analysis.
- Select Regression from the list and click OK.
- In the dialog box:
- Input Y Range: Select your dependent variable (e.g., Sales)
- Input X Range: Select your independent variable(s) (e.g., Ads)
- Check Labels if your selection includes headers.
- Choose an output range or new worksheet.
- Click OK.
Excel will generate a regression output table with coefficients, R-squared values, significance (p-values), and more.

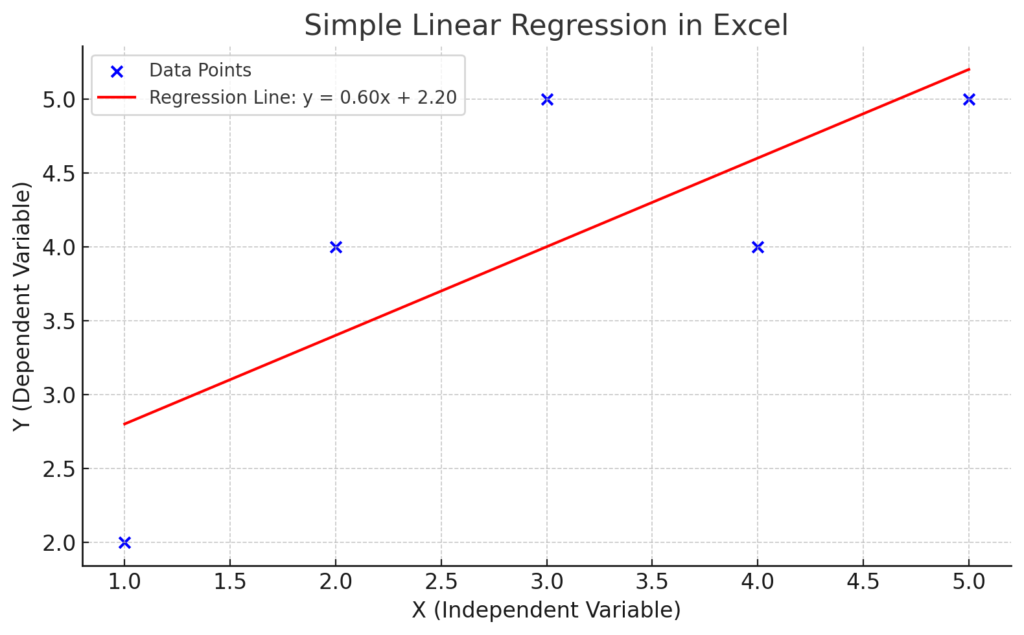
Example of Running Regression in Excel
Scenario:
You want to analyze if ad spend impacts sales.
| Ad Spend (X) | Sales (Y) |
| 1000 | 7000 |
| 1500 | 8500 |
| 2000 | 9800 |
| 2500 | 11200 |
After running regression, Excel might return an equation like:
Sales = 1200 + 3.8 × Ad Spend
This means for every extra dollar spent on ads, sales increase by $3.80 (on average), with $1,200 being the baseline (intercept).
R-squared value of 0.95 would indicate a very strong fit.

Benefits of Running Regression in Excel
Predict Future Outcomes
Regression helps forecast future trends based on historical data. Use past sales data to predict upcoming revenue based on estimated ad spend.
Identify Key Drivers of Results
Regression tells you which variable has the most influence on your target. In HR data, you might find years of experience predicts salary more than education level.
Data-Driven Decision Making
Regression gives quantifiable evidence to support business strategies. Marketing managers can decide budget allocation using regression-backed ROI insights.
Minimize Errors in Planning
Understanding variable relationships helps in better forecasting with reduced error margins. Use regression to determine optimal inventory levels based on customer demand trends.
Easily Accessible in Excel
No need for expensive software like SPSS or R—Excel handles basic regression for free with the Toolpak. Most professionals already use Excel, making adoption easy and immediate.
Education and Academic Use
Students and researchers can perform regression analyses quickly without specialized software. Common in psychology, economics, and management coursework.
Using Excel for Regression Analysis
Frequently Asked Questions (FAQ’s)
What is the difference between correlation and regression?
- Correlation measures the strength of a relationship.
- Regression describes the relationship and allows predictions.
Can I run multiple regression in Excel?
Yes. Simply select multiple columns in your X Range input. Excel will include them all in the model.
What does R-squared mean in regression?
R-squared (R²) indicates how well your model fits the data.
- R² = 0.8 means 80% of the variance in Y is explained by X.
What is a p-value in Excel regression output?
P-value tells you if a variable is statistically significant. A p-value under 0.05 usually shows strong evidence that the variable influences the dependent variable.
Can I use regression in Excel Online?
Excel Online currently doesn’t support the Data Analysis Toolpak. Use the desktop version for regression.
What if I get an error in regression output?
Ensure:
- No empty cells in the data range.
- Independent and dependent variables are numeric.
- Toolpak is correctly installed.
Conclusion
Regression analysis in Excel is a strong and easy tool. It helps find data relationships, forecast outcomes, and make decisions based on evidence. The built-in Data Analysis Toolpak helps everyone, even non-statisticians, get valuable insights. You don’t need expensive tools or advanced coding skills to use it. Regression helps with smarter decision-making in many areas. It’s useful in marketing strategy, academic research, and business forecasting. You now have practical steps, real-life examples, and clear benefits. So, you’re ready to run your own regression analysis with confidence.