

In data-driven research, it’s important to understand how different independent variables work together. This interaction affects the dependent variable. That’s where Factorial ANOVA (Analysis of Variance) comes in. Setting up your data right in Excel is key for accurate statistical analysis. Excel lacks built-in factorial ANOVA tools like SPSS or R. However, you can use the Data Analysis ToolPak to run this test, as long as your data is set up correctly.
What is Factorial ANOVA?
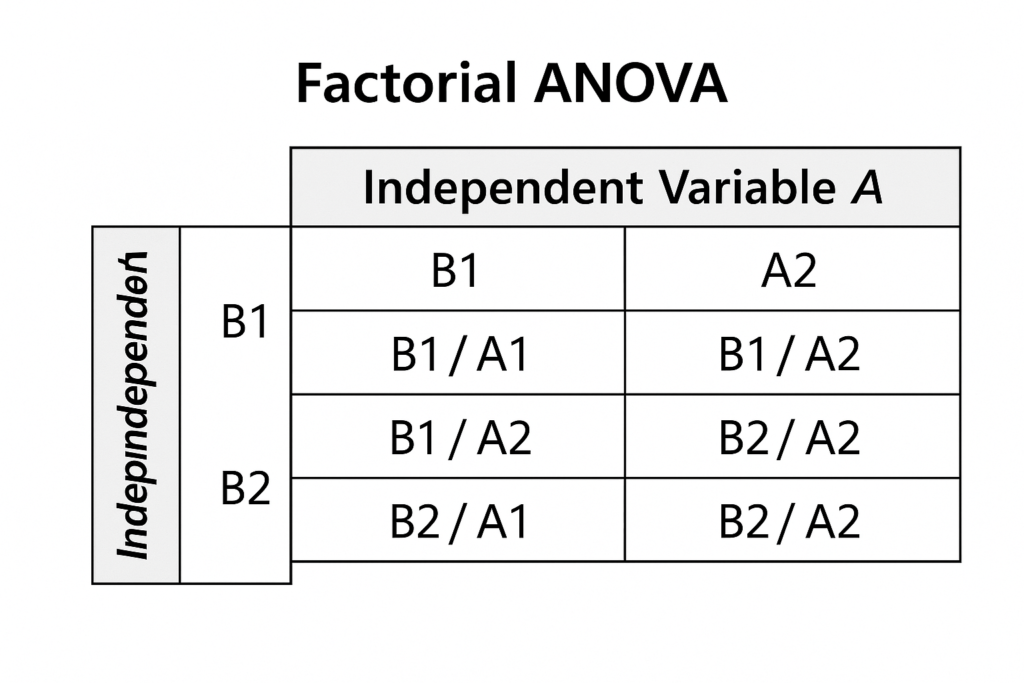
Factorial ANOVA is a statistical test. It examines how two or more independent factors influence one dependent variable. It not only evaluates the main effects of each factor but also their interaction effects.
Key Characteristics:
- Two or more independent variables (factors)
- One dependent variable (continuous)
- Helps assess combined and individual effects
- Often used in experimental and behavioral research
Example:
A study looks at how study time (Factor A) and learning method (Factor B) impact test scores (Dependent Variable). Factorial ANOVA reveals how each factor influences results individually and together.
How to Set Up Data in Excel for Factorial ANOVA
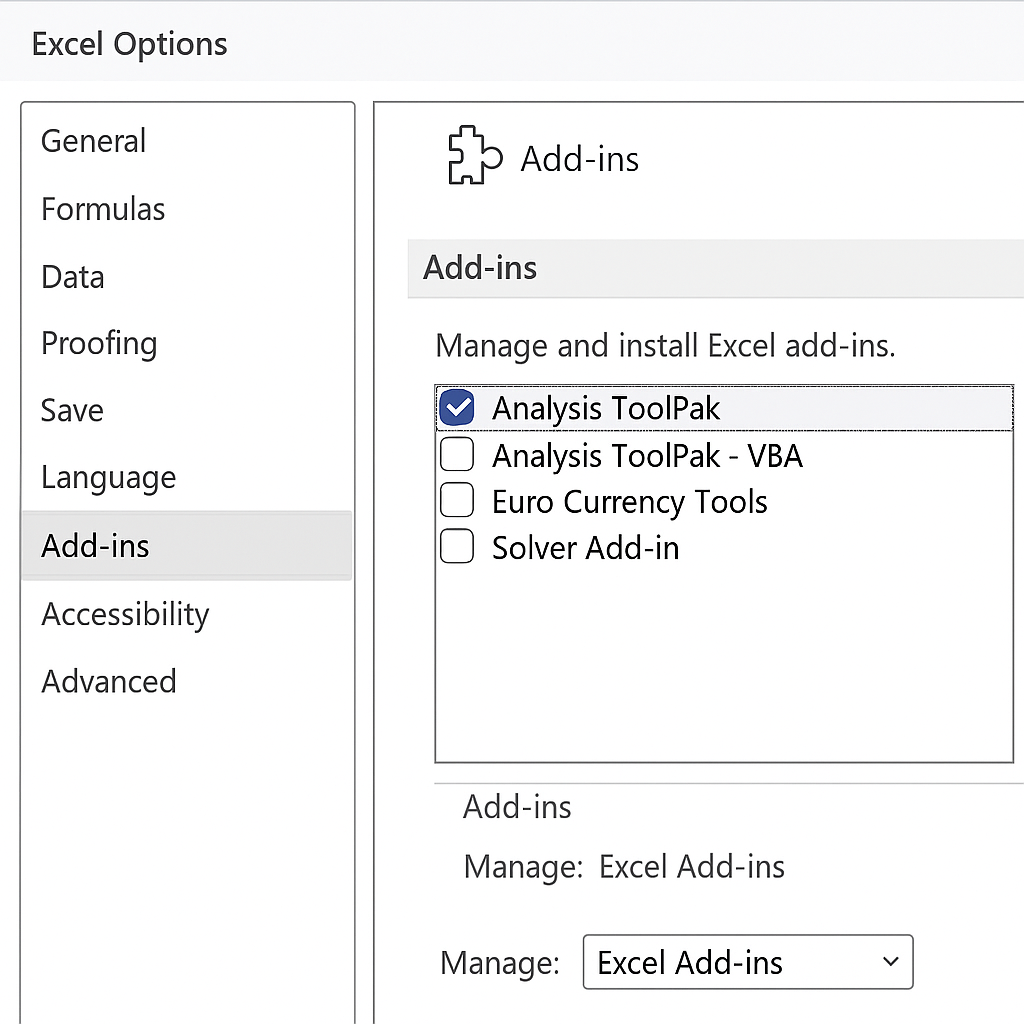
Step 1: Enable the Analysis ToolPak
Before setting up your data:
- Go to File > Options > Add-ins.
- Click Go next to Manage Excel Add-ins.
- Check Analysis ToolPak, then click OK.
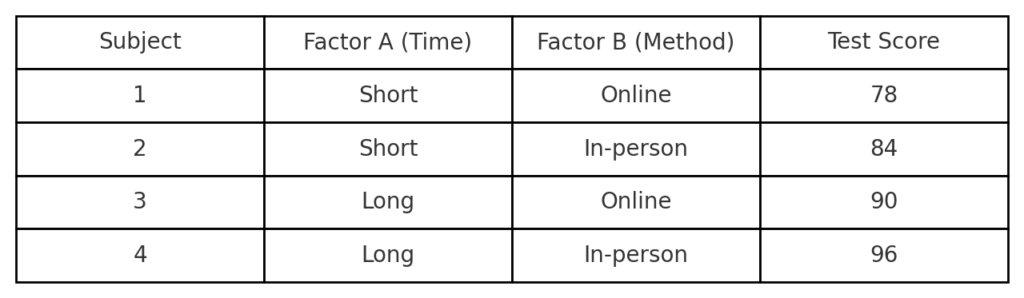
Step 2: Structure Your Data Properly
Each column must represent a variable. Here’s a recommended format:
| Subject | Factor A (Time) | Factor B (Method) | Test Score |
| 1 | Short | Online | 78 |
| 2 | Short | In-person | 84 |
| 3 | Long | Online | 90 |
| 4 | Long | In-person | 96 |
- Subject: Identifies each test subject (optional for Excel but helpful).
- Factor A and Factor B: Independent variables.
- Test Score: Dependent variable.
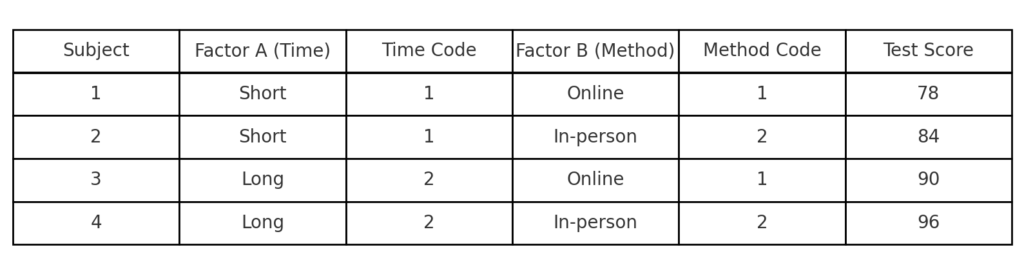
Step 3: Code Categorical Variables (If Needed)
For Excel to process the data:
Convert categorical factors (e.g., “Short”, “Long”) into numerical codes:
- Short = 1, Long = 2
- Online = 1, In-person = 2
Step 4: Run ANOVA
Excel doesn’t support multi-factor ANOVA directly, but you can:
- Use “ANOVA: Two-Factor With Replication” if you have repeated measures.
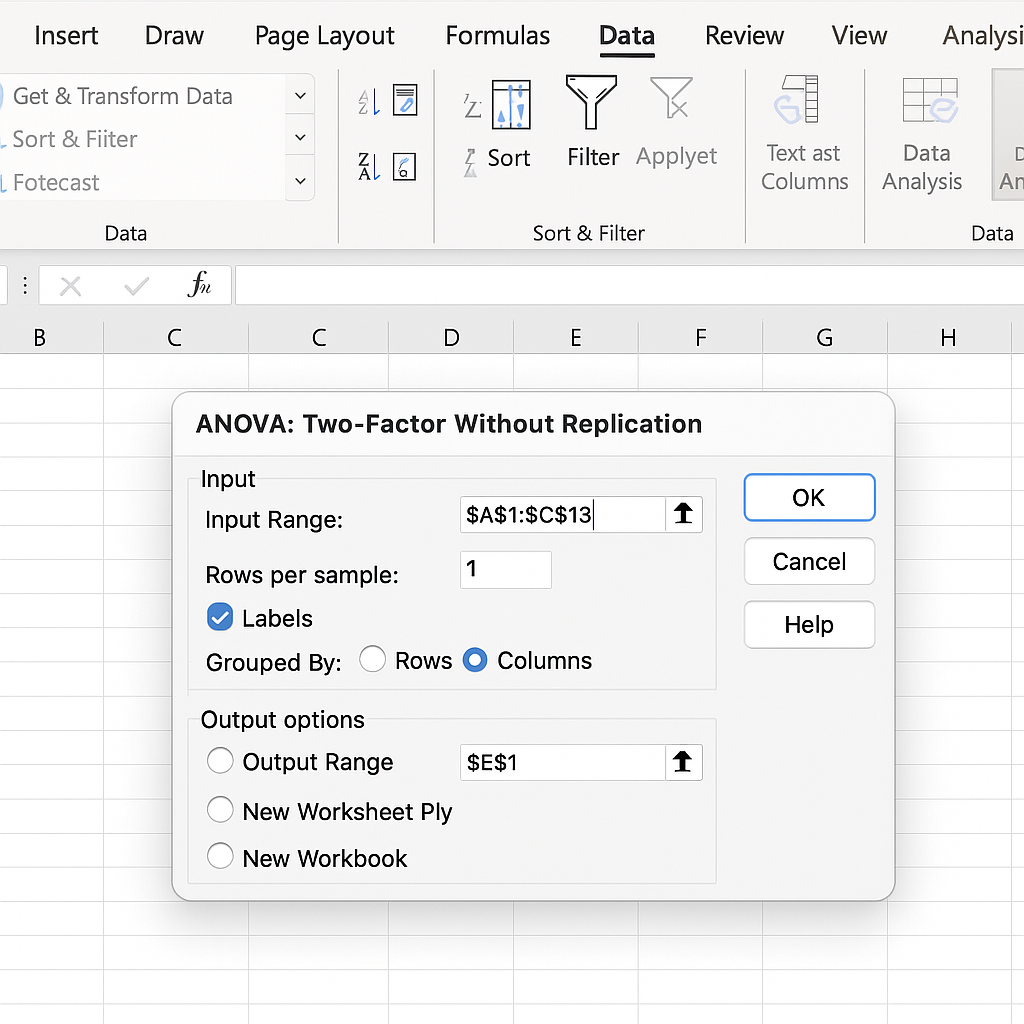
- Use “ANOVA: Two-Factor Without Replication” for one observation per group.
Navigate to:
- Data > Data Analysis > ANOVA: Two-Factor With/Without Replication
- Input the data range and grouping
- Select output range or new worksheet
- Click OK to generate the results
Examples of Set Up Data in Excel for Factorial ANOVA
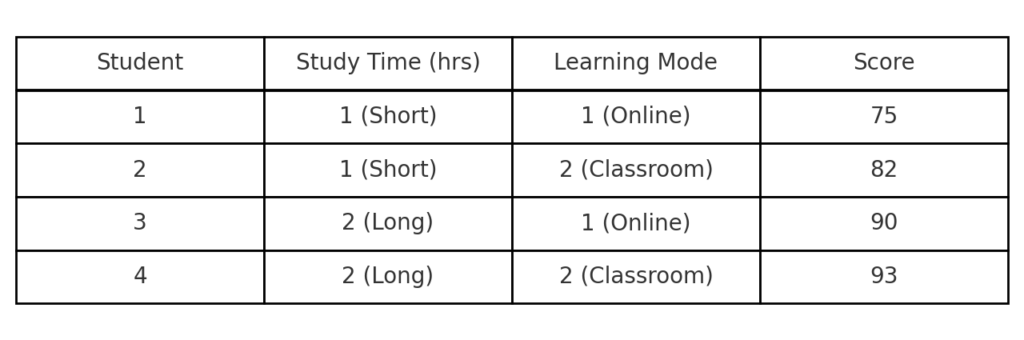
Example 1: Education Study
| Student | Study Time (hrs) | Learning Mode | Score |
| 1 | 1 (Short) | 1 (Online) | 75 |
| 2 | 1 (Short) | 2 (Classroom) | 82 |
| 3 | 2 (Long) | 1 (Online) | 90 |
| 4 | 2 (Long) | 2 (Classroom) | 93 |
This setup lets us analyze individual effects as well as how study time and learning mode interact.
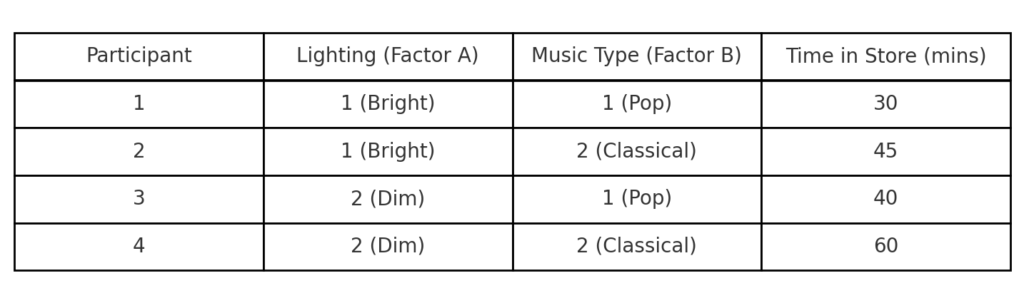
Example 2: Product Testing
A company studies how lighting (Factor A) and music type (Factor B) influence shopping behavior, like time spent in the store. Excel helps analyze these interactions using coded categorical data.
Benefits of Setting Up Factorial ANOVA in Excel
Cost-Efficient Statistical Analysis
You can use Excel’s Analysis ToolPak for basic factorial analysis. This means you won’t need expensive software like SPSS or SAS.
Why it matters: It’s perfect for students, startups, and small researchers. They get strong tools at no extra cost.
User-Friendly Data Organization
Excel’s table format helps you see how factors relate to the dependent variable.
Why it matters: Reduces data setup errors and simplifies interpretation before running ANOVA.
Quick Computation and Reporting
After activating the ToolPak, Excel creates summary tables. These tables include F-statistics, p-values, and interaction terms. You can easily use them in reports or presentations.
Why it matters: It saves time in academic and professional settings where quick responses are key.
Easily Modifiable
Need to test different variables or restructure your study? Just change the input data in the sheet and rerun the analysis.
Why it matters: Encourages experimentation and hypothesis testing without complex recoding.
Integrates With Other Excel Features
Excel offers data validation, drop-downs, charts, and conditional formatting. These tools improve clarity and presentation of your dataset.
Why it matters: Enables better communication of data insights with stakeholders.
FAQ’s on Setting Up Factorial ANOVA in Excel
Can Excel do full factorial ANOVA with three or more factors?
Not directly. Excel’s ToolPak supports two-factor ANOVA. For more complex models, consider software like R, SPSS, or Python (statsmodels).
Is replication necessary?
Replication is recommended for valid results. Without replication, ANOVA cannot test for interactions accurately.
Do I need to normalize or clean my data?
Yes. Ensure no empty cells, and code categorical data appropriately. Clean, well-structured data ensures accurate output.
How do I interpret the output?
Focus on:
- F-statistic: Determines variance between groups.
- p-value: If less than 0.05, the effect is statistically significant.
- Interaction row: Shows whether the factors influence each other’s effect.
Is Excel’s ANOVA result reliable?
For two-factor analysis with clean data, yes. However, Excel lacks diagnostics (e.g., residual plots). For deeper analysis, use statistical tools.
Conclusion
Factorial ANOVA helps us see how different factors impact one result. Setting up your data correctly in Excel is crucial for accurate results. Using the Analysis ToolPak and some formatting tricks, Excel is great for basic factorial ANOVA. This applies to academic research, business testing, and behavioral analysis.